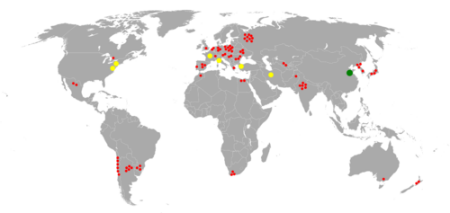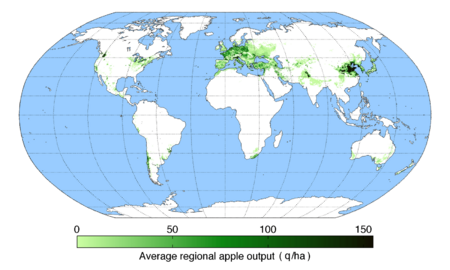
Countries by apple production in 2016

A map of apple output in 2005

A map of world apple producing regions in 2000
This is a list of countries by apple production in 2019, 2020, 2021 and 2022 based on data from the Food and Agriculture Organization Corporate Statistical Database The estimated total world production of apples in 2022 was 95,835,965 metric tonnes, up 2.0% from 93,924,721 tonnes in 2021.
Contents
- List of countries by production quantity
- >1,000,000 tonnes
- 100,000–1,000,000 tonnes
- 50,000–100,000 tonnes
- 10,000–50,000 tonnes
- 1,000–10,000 tonnes
- <1,000 tonnes
- List of countries by area harvested for apples
List of countries by production quantity
>1,000,000 tonnes
| Rank |
Country/region |
2022 |
2021 |
2020 |
2019 |
| – |
World |
95,835,965 |
93,924,721 |
90,603,540 |
87,462,289 |
| 1 |
 China China |
47,571,800 |
45,983,400 |
44,066,100 |
42,425,400 |
| 2 |
 Turkey Turkey |
4,817,500 |
4,493,264 |
4,300,486 |
3,618,752 |
| 3 |
 United States United States |
4,429,330 |
4,505,310 |
4,665,199 |
5,028,526 |
| 4 |
 Poland Poland |
4,264,700 |
4,067,400 |
3,555,200 |
3,080,600 |
| 5 |
 India India |
2,589,000 |
2,276,000 |
2,814,000 |
2,316,000 |
| 6 |
 Russia Russia |
2,379,900 |
2,215,300 |
2,040,700 |
1,950,800 |
| 7 |
 Italy Italy |
2,256,240 |
2,211,740 |
2,462,440 |
2,303,690 |
| 8 |
 Iran Iran |
1,989,734 |
2,767,822 |
2,241,100 |
2,241,124 |
| 9 |
 France France |
1,785,660 |
1,633,080 |
1,743,360 |
1,753,500 |
| 10 |
 Chile Chile |
1,479,683 |
1,561,452 |
1,612,626 |
1,607,826 |
| 11 |
 Uzbekistan Uzbekistan |
1,313,233 |
1,238,188 |
1,148,455 |
1,124,017 |
| 12 |
 South Africa South Africa |
1,231,867 |
1,148,771 |
998,785 |
895,399 |
| 13 |
 Ukraine Ukraine |
1,129,120 |
1,278,870 |
1,114,570 |
1,153,970 |
| 14 |
 Germany Germany |
1,070,980 |
1,004,630 |
1,023,320 |
991,450 |
| 15 |
 Brazil Brazil |
1,047,217 |
1,297,424 |
983,255 |
1,222,949 |
100,000–1,000,000 tonnes
| Rank |
Country/region |
2022 |
2021 |
2020 |
2019 |
| 16 |
 Egypt Egypt |
934,414 |
863,370 |
751,200 |
701,435 |
| 17 |
 Morocco Morocco |
922,820 |
889,736 |
778,866 |
809,762 |
| 18 |
 Mexico Mexico |
817,806 |
631,767 |
714,203 |
761,483 |
| 19 |
 North Korea North Korea |
801,533 |
798,587 |
795,642 |
792,079 |
| 20 |
 Pakistan Pakistan |
758,298 |
732,287 |
671,716 |
603,922 |
| 21 |
 Japan Japan |
737,100 |
661,900 |
763,300 |
701,600 |
| 22 |
 New Zealand New Zealand |
575,553 |
567,162 |
559,926 |
555,627 |
| 23 |
 South Korea South Korea |
566,041 |
515,931 |
422,115 |
535,324 |
| 24 |
 United Kingdom United Kingdom |
555,998 |
463,593 |
631,597 |
610,444 |
| 25 |
 Romania Romania |
543,380 |
593,700 |
537,470 |
492,700 |
| 26 |
 Algeria Algeria |
539,852 |
522,317 |
566,824 |
558,830 |
| 27 |
 Belarus Belarus |
532,700 |
532,700 |
532,655 |
336,697 |
| 28 |
 Spain Spain |
496,305 |
615,830 |
522,100 |
638,840 |
| 29 |
 Serbia Serbia |
486,215 |
513,238 |
489,426 |
499,578 |
| 30 |
 Moldova Moldova |
447,700 |
674,700 |
480,368 |
610,921 |
| 31 |
 Argentina Argentina |
423,343 |
514,000 |
587,000 |
547,846 |
| 32 |
 Canada Canada |
380,571 |
351,565 |
390,999 |
382,771 |
| 33 |
 Hungary Hungary |
350,100 |
514,520 |
398,710 |
498,330 |
| 34 |
 Syria Syria |
331,821 |
301,610 |
267,823 |
286,564 |
| 35 |
 Azerbaijan Azerbaijan |
318,197 |
308,386 |
301,411 |
292,736 |
| 36 |
 Afghanistan Afghanistan |
318,000 |
321,672 |
270,857 |
250,324 |
| 37 |
 Australia Australia |
300,518 |
284,897 |
262,966 |
265,150 |
| 38 |
 Portugal Portugal |
291,190 |
368,230 |
286,080 |
370,710 |
| 39 |
 Greece Greece |
289,180 |
286,860 |
303,580 |
277,110 |
| 40 |
 Kazakhstan Kazakhstan |
267,919 |
262,809 |
259,128 |
216,540 |
| 41 |
 Austria Austria |
260,610 |
206,290 |
258,220 |
239,210 |
| 42 |
 Lebanon Lebanon |
248,209 |
255,011 |
245,150 |
216,860 |
| 43 |
 Belgium Belgium |
238,600 |
249,740 |
168,030 |
241,860 |
| 44 |
 Tajikistan Tajikistan |
237,616 |
238,722 |
237,980 |
236,146 |
| 45 |
 Netherlands Netherlands |
236,000 |
245,000 |
220,000 |
273,000 |
| 46 |
 Bosnia and Herzegovina Bosnia and Herzegovina |
211,101 |
82,591 |
109,071 |
98,265 |
| 47 |
 Switzerland Switzerland |
209,029 |
167,911 |
237,232 |
196,223 |
| 48 |
 North Macedonia North Macedonia |
164,530 |
92,863 |
105,794 |
88,701 |
| 49 |
 Kyrgyzstan Kyrgyzstan |
137,102 |
136,652 |
136,920 |
137,734 |
| 50 |
 Peru Peru |
133,022 |
143,265 |
139,514 |
144,868 |
| 51 |
 Czechia Czechia |
131,350 |
114,960 |
115,590 |
99,500 |
| 52 |
 Tunisia Tunisia |
127,000 |
128,000 |
153,000 |
116,000 |
| 53 |
 Israel Israel |
104,000 |
101,000 |
104,000 |
104,000 |
| 54 |
 Albania Albania |
103,645 |
111,247 |
102,167 |
107,713 |
50,000–100,000 tonnes
| Rank |
Country/region |
2033 |
2021 |
2020 |
2019 |
| 55 |
 Armenia Armenia |
87,542 |
87,914 |
84,676 |
81,674 |
| 56 |
 Iraq Iraq |
77,800 |
78,917 |
79,413 |
75,831 |
| 57 |
 Georgia Georgia |
76,700 |
73,700 |
89,000 |
44,300 |
| 58 |
 Turkmenistan Turkmenistan |
64,831 |
64,658 |
66,321 |
63,513 |
| 59 |
 Lithuania Lithuania |
51,420 |
36,440 |
51,880 |
32,070 |
10,000–50,000 tonnes
| Rank |
Country/region |
2022 |
2021 |
2020 |
2019 |
| 60 |
 Nepal Nepal |
49,989 |
47,865 |
45,205 |
31,386 |
| 61 |
 Uruguay Uruguay |
49,840 |
46,987 |
37,039 |
42,322 |
| 62 |
 Slovenia Slovenia |
48,840 |
23,010 |
66,120 |
54,270 |
| 63 |
 Croatia Croatia |
46,810 |
59,690 |
63,610 |
68,350 |
| 64 |
 Bulgaria Bulgaria |
46,400 |
44,030 |
37,870 |
43,620 |
| 65 |
 El Salvador El Salvador |
44,407 |
44,727 |
44,696 |
43,798 |
| 66 |
 Denmark Denmark |
41,030 |
30,560 |
40,020 |
25,210 |
| 67 |
 Yemen Yemen |
34,714 |
32,323 |
22,554 |
21,946 |
| 68 |
 Sweden Sweden |
31,540 |
32,230 |
29,360 |
22,210 |
| 69 |
 Slovakia Slovakia |
31,070 |
29,590 |
28,430 |
35,190 |
| 70 |
 Guatemala Guatemala |
26,043 |
25,895 |
25,719 |
25,326 |
| 71 |
 Ireland Ireland |
23,200 |
15,860 |
19,470 |
19,880 |
| 72 |
 Norway Norway |
17,077 |
18,721 |
12,055 |
15,753 |
| 73 |
 Jordan Jordan |
16,157 |
17,007 |
19,613 |
21,051 |
| 74 |
 Colombia Colombia |
13,357 |
13,081 |
12,228 |
12,441 |
| 75 |
 Libya Libya |
10,085 |
22,612 |
16,260 |
8,430 |
| 76 |
 Latvia Latvia |
10,040 |
8,200 |
13,900 |
10,390 |
1,000–10,000 tonnes
| Rank |
Country/region |
2022 |
2021 |
2020 |
2019 |
| 77 |
 Ecuador Ecuador |
7,210 |
7,192 |
7,164 |
7,274 |
| 78 |
 Madagascar Madagascar |
7,165 |
7,156 |
7,146 |
7,162 |
| 79 |
 Finland Finland |
7,010 |
7,890 |
7,170 |
8,090 |
| 80 |
 Zimbabwe Zimbabwe |
6,825 |
6,820 |
6,816 |
6,863 |
| 81 |
 Estonia Estonia |
3,290 |
1,970 |
1,260 |
1,850 |
| 82 |
 Malawi Malawi |
3,162 |
3,161 |
3,312 |
2,979 |
| 83 |
 Cyprus Cyprus |
2,900 |
3,010 |
2,670 |
1,840 |
| 84 |
 Bolivia Bolivia |
2,795 |
2,739 |
2,750 |
2,931 |
| 85 |
 Bhutan Bhutan |
2,223 |
2,324 |
4,056 |
4,321 |
| 86 |
 Kenya Kenya |
2,000 |
992 |
106 |
261 |
| 87 |
 Saint Vincent and the Grenadines Saint Vincent and the Grenadines |
1,645 |
1,516 |
1,500 |
1,482 |
| 88 |
 Montenegro Montenegro |
1,535 |
1,517 |
1,402 |
1,487 |
| 89 |
 Taiwan Taiwan |
1,400 |
1,458 |
1,041 |
1,178 |
| 90 |
 Luxembourg Luxembourg |
1,380 |
1,010 |
1,380 |
1,930 |
<1,000 tonnes
List of countries by area harvested for apples
This is a list of the top ten countries by area harvested for apples in hectares (ha). The total area harvested in the world for apples was 4,825,729 hectares in 2022, up 0.02% from 4,825,629 hectares in 2021.
| Rank |
Country |
2022 |
2021 |
2020 |
2019 |
| 1 |
 China China |
2,128,943 |
2,103,488 |
2,082,849 |
2,041,197 |
| 2 |
 India India |
315,000 |
313,000 |
310,000 |
308,000 |
| 3 |
 Russia Russia |
232,842 |
222,516 |
210,592 |
207,003 |
| 4 |
 Turkey Turkey |
170,941 |
168,811 |
170,903 |
174,439 |
| 5 |
 Poland Poland |
151,900 |
161,900 |
152,600 |
155,620 |
| 6 |
 Uzbekistan Uzbekistan |
122,459 |
111,575 |
109,849 |
98,525 |
| 7 |
 United States United States |
116,753 |
116,874 |
119,707 |
119,301 |
| 8 |
 Iran Iran |
87,644 |
126,024 |
102,988 |
100,759 |
| 9 |
 Ukraine Ukraine |
76,900 |
84,400 |
85,000 |
87,700 |
| 10 |
 Pakistan Pakistan |
74,061 |
76,044 |
77,429 |
78,296 |


