Diagram facts for kids
A diagram is usually a two-dimensional display which communicates using visual relationships. It is a simplified and structured visual representation of concepts, ideas, constructions, relations, statistical data, anatomy etc. It may be used for all aspects of human activities to explain or illustrate a topic.
Contents
Discussion

- visual information device: Like the term "illustration" the diagram is used as a collective term standing for the whole class of technical genres, including graphs, technical drawings and tables.
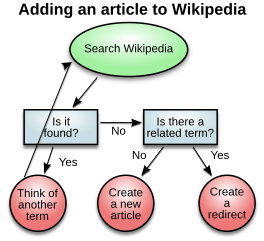
- specific kind of visual display: This is the genre that shows qualitative data with shapes that are connected by lines, arrows, or other visual links.
In science the term is used in both ways. For example, Anderson (1997) stated more generally: "diagrams are pictorial, yet abstract, representations of information, and maps, line graphs, bar charts, engineering blueprints, and architects' sketches are all examples of diagrams, whereas photographs and video are not". On the other hand, Lowe (1993) defined diagrams as specifically "abstract graphic portrayals of the subject matter they represent".
Visual thinking
Diagrams affect the mind so that the viewer comes to understand them, but not in the way one understands words. Visual thinking or problem-solving is very ancient, and largely automatic. One only has to remember that the brain puts together an image of the world around us based on sensory input, mostly sight. We do not make any conscious decisions: it is done without conscious thought. Diagrams most likely "tap in" to some of these ancient – but largely unknown – routines.
In fact these normally hidden brain processes do sometimes become apparent. When brain damage affects the visual cortex, or when visual illusions are created, are two classic examples.
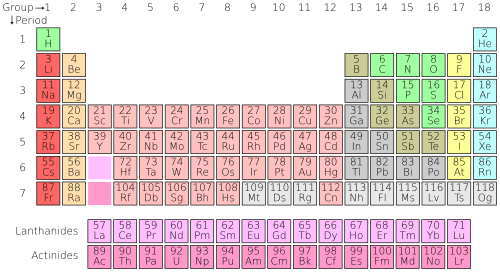
The way some diagrams affect thinking is quite important. Mendeleev's periodic table summarised previous research on the elements. Far more important, though, was the way it suggested the properties of elements which were not yet discovered. This diagram stimulated creative thought, and other examples from the history of science could be given: see Feynman diagram.
Basic diagram types
Examples
- Circuit diagram
- Euler diagram
- Family tree
- Feynman diagram
- Gantt chart – shows the timing of tasks or activities (used in project management)
- Mind map – used for learning, brainstorming, memory, visual thinking and problem solving
- Organisation
- Piping and instrumentation diagram
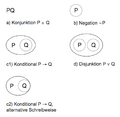
- Venn diagram
Some main diagram types
There are at least the following types of diagrams:
- Graph-based diagrams: relationships are expressed as connections between the items or overlaps between the items; examples:
|
|
- Chart-like diagram techniques, which display a relationship between two variables that take either discrete or a continuous ranges of values; examples:
|
|
Schematics and other types of diagrams, e.g.,
|
|
Images for kids
See also
 In Spanish: Diagrama para niños


