Gantt chart facts for kids
A Gantt chart is a type of bar chart. It is a tool of project management invented by the engineer Henry L. Gantt in the 1910s. The chart illustrates a project schedule.
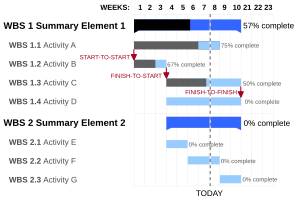
Gantt charts show the start and finish dates of the elements of a project. Gantt charts show the "dependency" between activities. What this means is that some activities can only begin after other activities are finished. Other activities can go on in parallel. Gantt charts can be used to show current schedule status using percent-complete shadings and a vertical "TODAY" line as shown here.
They are now a common charting technique, but Gantt charts were thought revolutionary when first introduced. The charts are also used in information technology to represent data that has been collected.
Images for kids
-
Henry Gantt, inventor of the Gantt chart
-
A Gantt chart created using Microsoft Project. Note (1) the critical path is in red, (2) the slack is the black lines connected to non-critical activities, (3) since Saturday and Sunday are not work days and are thus excluded from the schedule, some bars on the Gantt chart are longer if they cut through a weekend.
See also
 In Spanish: Diagrama de Gantt para niños


