Histogram facts for kids
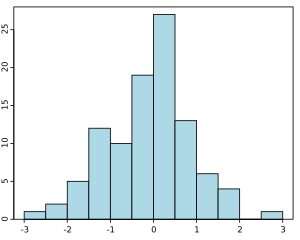
A histogram is a concept from statistics. It is a graphical display that tells us about the distribution of the samples involved. They are commonly a picture made from a table with many categories. The table tells how many samples there are in each category.
The word histogram is derived from histos and gramma in Greek. Histos means web or mast. Gramma means drawing, record or writing. A histogram of something is therefore, etymologically speaking, a drawing of the web of this something.
Similar ideas
The histogram is one of the seven basic tools of quality control, which also include the Pareto chart, check sheet, control chart, cause-and-effect diagram, flowchart, and scatter diagram.
A population pyramid is two histograms.
A generalization of the histogram is kernel smoothing techniques. This will construct a smooth probability density function from the supplied data.
Images for kids
-
Histogram and density function for a Gumbel distribution
See also
 In Spanish: Histograma para niños


