Image: GaussianScatterPCA

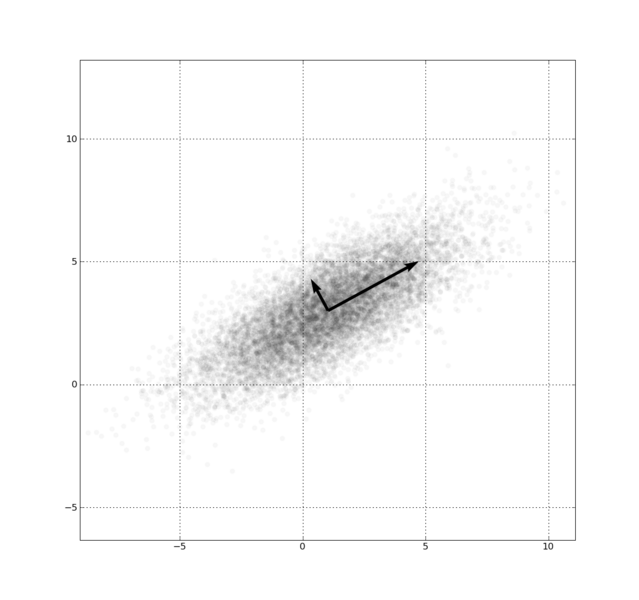
Description: A scatter plot of samples that are distributed according a multivariate (bivariate) Gaussian distribution centered at (1,3) with a standard deviation of 3 in roughly the (0.878, 0.478) direction and of 1 in the orthogonal direction. The directions represent the Principal Components (PC) associated with the sample.
Title: GaussianScatterPCA
Credit: PNG version of gigantic SVG Own work (Original caption: “I created this work entirely by myself. (Originally uploaded on en.wikipedia) -”)
Author: —Ben FrantzDale (talk) (Transferred by ILCyborg)
Usage Terms: Creative Commons Attribution-Share Alike 3.0
License: CC-BY-SA-3.0
License Link: http://creativecommons.org/licenses/by-sa/3.0/
Attribution Required?: Yes
Image usage
The following page links to this image:

