Quick facts for kids {{{Name}}}
[[{{{Type}}} constituency]] |
[[Image:{{{Map1}}}Constituency.svg|120px|]]
[[Image:England{{{Map2}}}.svg|120px|]] |
| {{{Name}}} shown within [[{{{Entity}}}]], and {{{Entity}}} shown within England |
| Created: |
{{{Year}}} |
| MP: |
{{{MP}}} |
| Party: |
{{{Party}}} |
| Type: |
House of Commons |
| County: |
[[{{{County}}}]] |
| EP constituency: |
[[{{{EP}}} (European Parliament constituency)|{{{EP}}}]] |
Wood Green was a constituency for the House of Commons of the UK Parliament 1918—1983, centred on the Wood Green area of North London and its earlier broadest form included much of the seat of Enfield Southgate, created in 1950. It returned one Member of Parliament (MP).
History
The Wood Green constituency was created for the 1918 general election and abolished for the 1983 general election.
It returned Conservative MPs until 1950, and then Labour or Labour Co-operative MPs until its abolition.
Boundaries

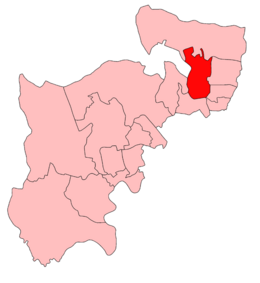
Wood Green in Middlesex, correct as to its boundaries 1918–50; many others shown here saw subdivision and change in 1945

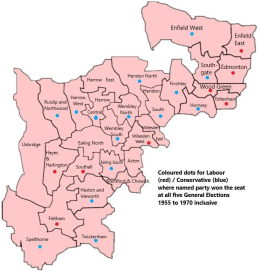
Map that gives each named seat and any constant electoral success for national (Westminster) elections for Middlesex, 1955 to 1974.
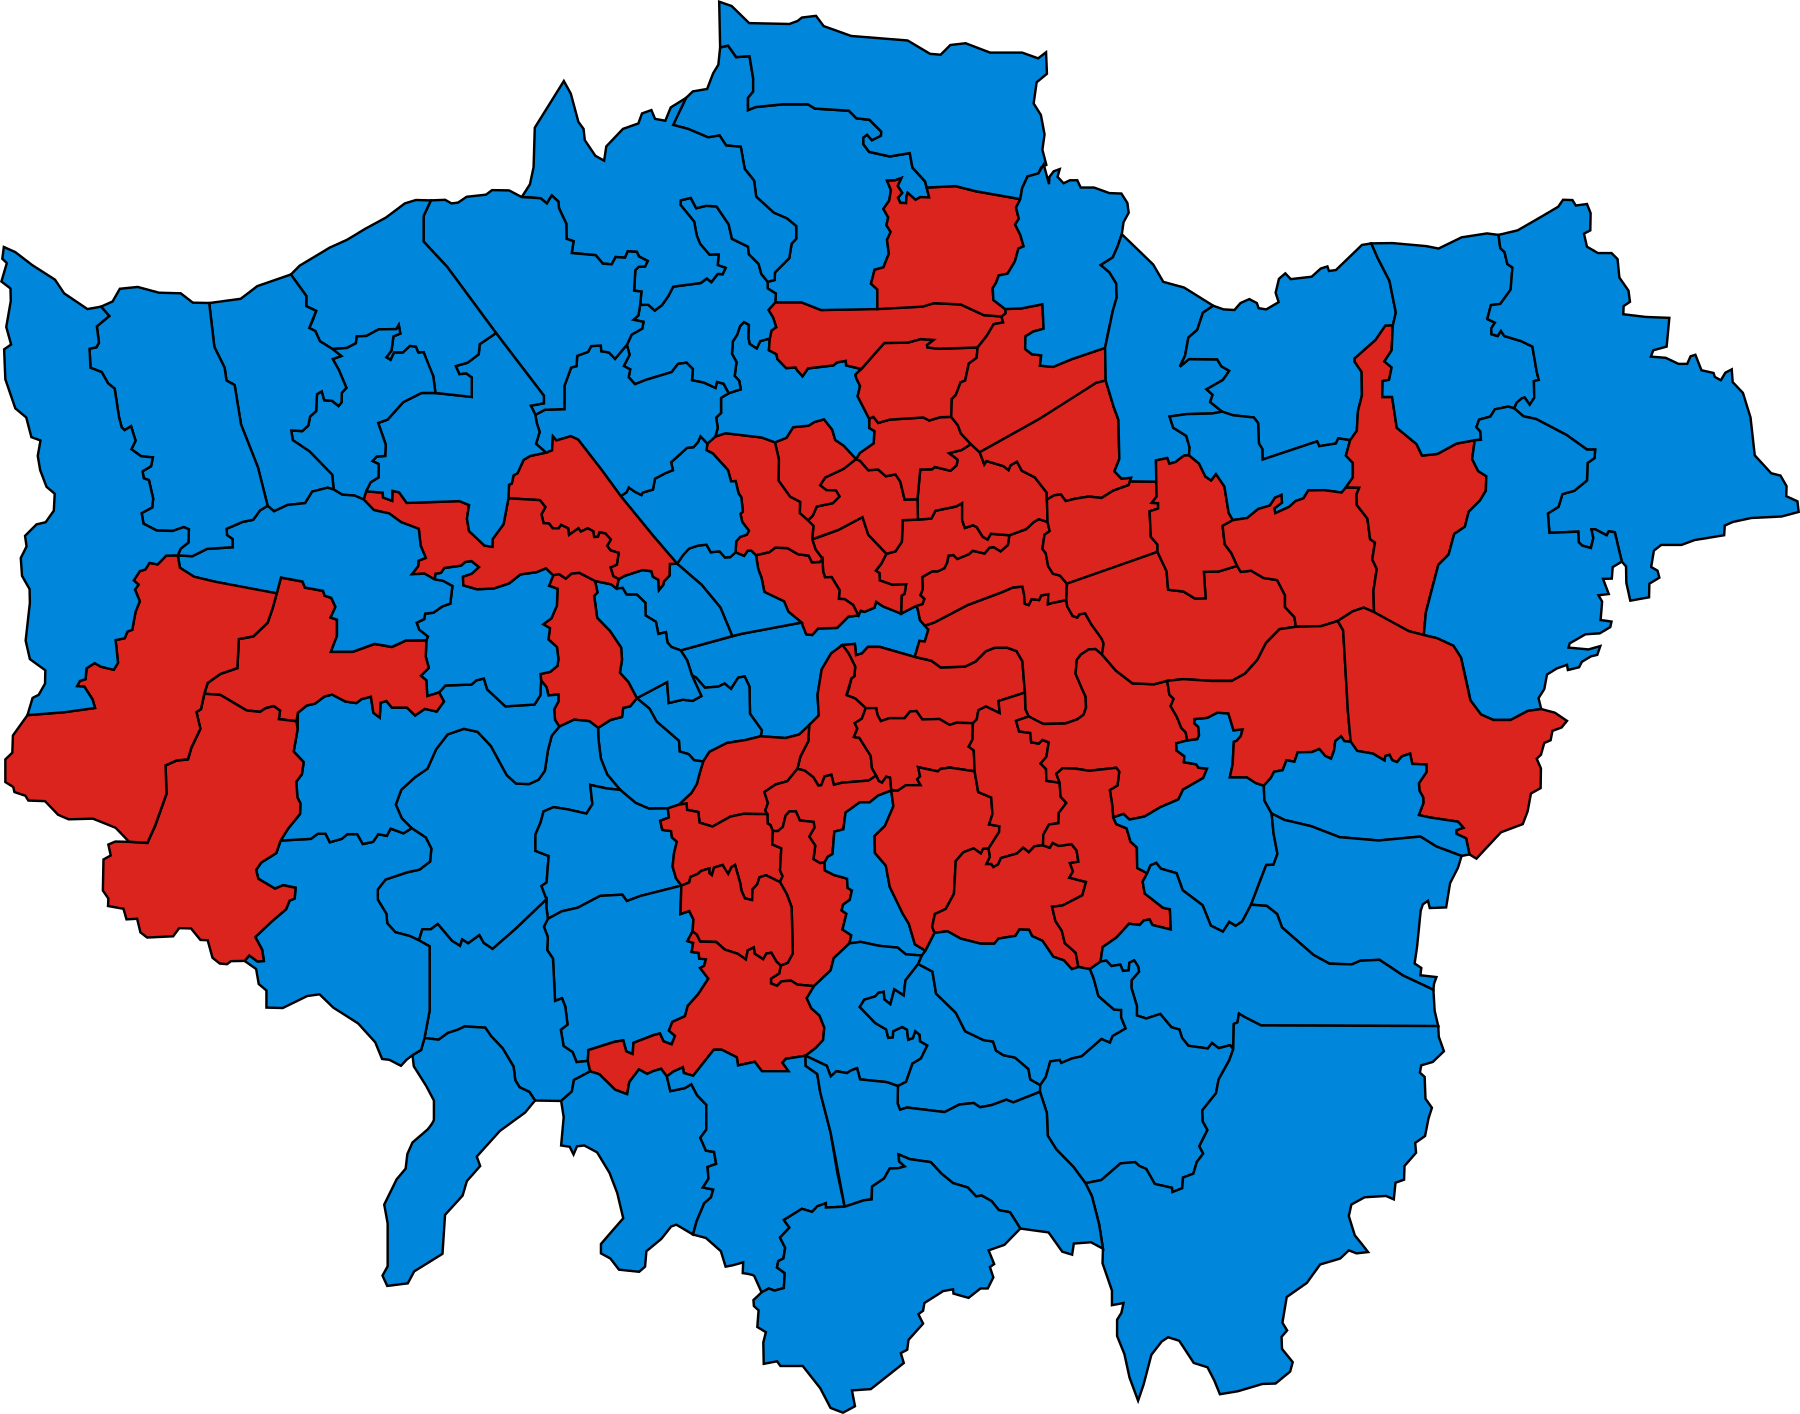
Final form of the seat. (Results shown: 1979)
1918–1950: The Urban Districts of Wood Green and Southgate.
1950–1974: The Borough of Wood Green, and the Borough of Tottenham wards of Coleraine, Park, and White Hart Lane.
1974–1983: The Borough of Haringey wards of Alexandra-Bowes, Coleraine, Noel Park, Park, and Town Hall.
Members of Parliament
Elections
Elections in the 1910s
Elections in the 1920s
| General election 1922: Wood Green |
| Party |
Candidate |
Votes |
% |
±% |
|
Unionist |
Godfrey Locker-Lampson |
21,937 |
70.0 |
-1.9 |
|
Labour |
Harri Tudor Rhys |
9,411 |
30.0 |
+13.0 |
| Majority |
12,526 |
40.0 |
-14.9 |
| Turnout |
31,348 |
66.5 |
+8.4 |
|
Unionist hold |
Swing |
|
|
| General election 1923: Wood Green |
| Party |
Candidate |
Votes |
% |
±% |
|
Unionist |
Godfrey Locker-Lampson |
15,344 |
46.5 |
-23.5 |
|
Liberal |
John Traill Stevenson |
11,975 |
36.3 |
New |
|
Labour |
James Bacon |
5,665 |
17.2 |
-12.8 |
| Majority |
3,369 |
10.2 |
-29.8 |
| Turnout |
32,984 |
69.1 |
+2.6 |
|
Unionist hold |
Swing |
|
|
| General election 1924: Wood Green |
| Party |
Candidate |
Votes |
% |
±% |
|
Unionist |
Godfrey Locker-Lampson |
21,725 |
57.9 |
+11.4 |
|
Labour |
Harri Tudor Rhys |
8,648 |
23.0 |
+5.8 |
|
Liberal |
John Traill Stevenson |
7,158 |
19.1 |
-17.2 |
| Majority |
13,077 |
34.9 |
+24.7 |
| Turnout |
37,531 |
76.3 |
+7.2 |
|
Unionist hold |
Swing |
|
|
| General election 1929: Wood Green |
| Party |
Candidate |
Votes |
% |
±% |
|
Unionist |
Godfrey Locker-Lampson |
24,821 |
47.6 |
-10.3 |
|
Liberal |
Hew Fraser |
14,995 |
28.7 |
+5.6 |
|
Labour |
E P Bell |
12,360 |
23.7 |
+0.7 |
| Majority |
9,826 |
18.9 |
-16.0 |
| Turnout |
52,176 |
73.0 |
-3.3 |
|
Unionist hold |
Swing |
-8.0 |
|
Elections in the 1930s
| General election 1931: Wood Green |
| Party |
Candidate |
Votes |
% |
±% |
|
Conservative |
Godfrey Locker-Lampson |
44,364 |
78.7 |
+31.1 |
|
Labour |
E. P. Bell |
11,980 |
21.3 |
-2.4 |
| Majority |
32,384 |
57.4 |
+38.5 |
| Turnout |
56,344 |
72.3 |
-0.7 |
|
Conservative hold |
Swing |
|
|
| General election 1935: Wood Green |
| Party |
Candidate |
Votes |
% |
±% |
|
Conservative |
Beverley Baxter |
36,384 |
62.0 |
-16.7 |
|
Labour |
Dorothy Woodman |
14,561 |
24.8 |
+3.5 |
|
Liberal |
Hew Fraser |
7,711 |
13.2 |
New |
| Majority |
21,823 |
37.2 |
-20.2 |
| Turnout |
58,656 |
69.1 |
-3.2 |
|
Conservative hold |
Swing |
|
|
General Election 1939–40: Another General Election was required to take place before the end of 1940. The political parties had been making preparations for an election to take place and by the Autumn of 1939, the following candidates had been selected;
- Conservative: Beverley Baxter
- Liberal: Hew Thomson Fraser
- Labour: Dorothy Woodman
Elections in the 1940s
| General election 1945: Wood Green |
| Party |
Candidate |
Votes |
% |
±% |
|
Conservative |
Beverley Baxter |
29,429 |
43.4 |
-18.6 |
|
Labour |
WA Vant |
23,544 |
34.7 |
+9.9 |
|
Liberal |
Edwin Malindine |
14,836 |
21.9 |
+8.7 |
| Majority |
5,885 |
8.7 |
-28.5 |
| Turnout |
67,809 |
74.9 |
+5.8 |
|
Conservative hold |
Swing |
|
|
Elections in the 1950s
Elections in the 1960s
Elections in the 1970s


