Vingåker Municipality facts for kids
Quick facts for kids
Vingåker Municipality
Vingåkers kommun
|
||
|---|---|---|

Vingåker Railway Station
|
||
|
||
 |
||
| Country | Sweden | |
| County | Södermanland County | |
| Seat | Vingåker | |
| Area | ||
| • Total | 441.86 km2 (170.60 sq mi) | |
| • Land | 372.47 km2 (143.81 sq mi) | |
| • Water | 69.39 km2 (26.79 sq mi) | |
| Area as of January 1, 2010. | ||
| Population
(June 30, 2012)
|
||
| • Total | 8,905 | |
| • Density | 20.1534/km2 (52.197/sq mi) | |
| Time zone | UTC+1 (CET) | |
| • Summer (DST) | UTC+2 (CEST) | |
| ISO 3166 code | SE | |
| Province | Södermanland | |
| Municipal code | 0428 | |
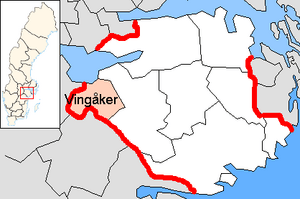
Vingåker Municipality (Vingåkers kommun) is a municipality in Södermanland County in central Sweden. Its seat is located in the town of Vingåker.
The municipality has its present size since the local government reform of 1971.
Contents
Geography
Vingåker is an inland municipality but in spite of this has mostly low elevation. The lowest point is the shoreline of Hjälmaren at 22 metres (72 ft) and the highest peak is at 116 metres (381 ft) near the Östergötland county line.
Localities (population)
Coat of arms
The creation of the arms has a peculiar and somewhat romantic story attached to it. It was the first arms created by a parish in the Södermanland province in 1941. It was inspired by a hop plant that some locals had seen on a farm. The left part of the arms, an oak tree, is the insignia for the historical Oppunda Hundred, stretching through the municipality.
Sights
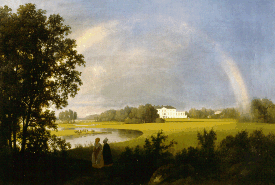
The renowned Säfstaholm Castle (slott) was bought by the municipality in 1968. It is used for exhibitions and other cultural events.
Demographics
This is a demographic table based on Vingåker Municipality's electoral districts in the 2022 Swedish general election sourced from SVT's election platform, in turn taken from SCB official statistics.
In total there were 9,058 residents, including 6,872 Swedish citizens of voting age. 46.0% voted for the left coalition and 53.0% for the right coalition. Indicators are in percentage points except population totals and income.
| Location | Residents | Citizen adults |
Left vote | Right vote | Employed | Swedish parents |
Foreign heritage |
Income SEK |
Degree |
|---|---|---|---|---|---|---|---|---|---|
| % | % | ||||||||
| Baggetorp-Marmorbyn | 1,282 | 985 | 43.5 | 55.2 | 87 | 90 | 10 | 27,689 | 30 |
| Centrum | 1,771 | 1,192 | 51.3 | 46.7 | 60 | 64 | 36 | 16,659 | 17 |
| Högsjö | 1,508 | 1,232 | 44.5 | 54.1 | 79 | 88 | 12 | 23,144 | 24 |
| Norra | 1,467 | 1,106 | 45.9 | 53.0 | 83 | 86 | 14 | 25,161 | 23 |
| Södra | 1,782 | 1,309 | 46.5 | 52.9 | 77 | 78 | 22 | 22,596 | 24 |
| Österåker | 1,248 | 1,048 | 43.8 | 55.8 | 81 | 92 | 8 | 24,206 | 29 |
| Source: SVT | |||||||||
Elections
The following results are since the 1972 municipal reform onwards. The results of the Sweden Democrats were not published by the SCB between 1988 and 1998 due to the party's small national size, and therefore has been marked out as "0.0".
Riksdag
| Year | Turnout | Votes | V | S | MP | C | L | KD | M | SD | ND |
|---|---|---|---|---|---|---|---|---|---|---|---|
| 1973 | 92.5 | 6,142 | 3.1 | 47.8 | 0.0 | 26.9 | 11.0 | 3.1 | 8.0 | 0.0 | 0.0 |
| 1976 | 93.5 | 6,492 | 2.6 | 46.8 | 0.0 | 28.6 | 10.3 | 2.2 | 9.4 | 0.0 | 0.0 |
| 1979 | 92.6 | 6,521 | 3.1 | 47.3 | 0.0 | 23.1 | 11.4 | 2.2 | 12.4 | 0.0 | 0.0 |
| 1982 | 93.5 | 6,620 | 3.3 | 51.0 | 1.8 | 20.2 | 6.8 | 2.7 | 14.2 | 0.0 | 0.0 |
| 1985 | 91.5 | 6,534 | 3.5 | 50.4 | 2.8 | 17.4 | 11.9 | 0.0 | 13.8 | 0.0 | 0.0 |
| 1988 | 87.9 | 6,287 | 4.1 | 50.7 | 6.3 | 14.5 | 10.2 | 3.2 | 10.7 | 0.0 | 0.0 |
| 1991 | 87.7 | 6,342 | 3.3 | 46.5 | 3.7 | 11.9 | 7.1 | 7.5 | 13.1 | 0.0 | 6.7 |
| 1994 | 89.6 | 6,389 | 4.7 | 52.4 | 8.9 | 9.7 | 4.7 | 3.8 | 15.1 | 0.0 | 0.5 |
| 1998 | 83.5 | 5,875 | 10.4 | 44.8 | 8.4 | 6.7 | 3.2 | 10.5 | 15.0 | 0.0 | 0.0 |
| 2002 | 82.2 | 5,598 | 4.9 | 52.9 | 5.0 | 7.4 | 8.6 | 8.2 | 11.0 | 0.7 | 0.0 |
| 2006 | 83.3 | 5,704 | 4.0 | 51.0 | 4.5 | 7.8 | 4.1 | 6.1 | 18.4 | 2.8 | 0.0 |
| 2010 | 85.9 | 5,841 | 4.1 | 41.5 | 6.5 | 6.8 | 4.1 | 4.7 | 24.1 | 7.3 | 0.0 |
| 2014 | 88.4 | 5,895 | 4.0 | 39.0 | 4.6 | 6.4 | 2.6 | 3.6 | 16.6 | 20.5 | 0.0 |
Blocs
This lists the relative strength of the socialist and centre-right blocs since 1973, but parties not elected to the Riksdag are inserted as "other", including the Sweden Democrats results from 1988 to 2006, but also the Christian Democrats pre-1991 and the Greens in 1982, 1985 and 1991. The sources are identical to the table above. The coalition or government mandate marked in bold formed the government after the election. New Democracy got elected in 1991 but are still listed as "other" due to the short lifespan of the party.
| Year | Turnout | Votes | Left | Right | SD | Other | Elected |
|---|---|---|---|---|---|---|---|
| 1973 | 92.5 | 6,142 | 50.9 | 45.9 | 0.0 | 3.2 | 96.8 |
| 1976 | 93.5 | 6,492 | 49.4 | 48.3 | 0.0 | 1.7 | 98.3 |
| 1979 | 92.6 | 6,521 | 50.4 | 47.9 | 0.0 | 1.5 | 98.5 |
| 1982 | 93.5 | 6,620 | 54.3 | 41.2 | 0.0 | 4.8 | 95.2 |
| 1985 | 91.5 | 6,534 | 53.9 | 43.1 | 0.0 | 3.0 | 97.0 |
| 1988 | 87.9 | 6,287 | 61.1 | 35.4 | 0.0 | 3.5 | 96.5 |
| 1991 | 87.7 | 6,342 | 49.8 | 39.6 | 0.0 | 10.6 | 95.1 |
| 1994 | 89.6 | 6,389 | 66.0 | 33.3 | 0.0 | 0.7 | 99.3 |
| 1998 | 83.5 | 5,875 | 63.6 | 35.4 | 0.0 | 1.0 | 99.0 |
| 2002 | 82.2 | 5,598 | 62.8 | 34.2 | 0.0 | 3.0 | 97.0 |
| 2006 | 83.3 | 5,704 | 60.5 | 38.4 | 0.0 | 1.1 | 98.9 |
| 2010 | 85.9 | 5,841 | 52.1 | 39.7 | 7.3 | 0.9 | 99.1 |
| 2014 | 88.4 | 5,895 | 47.6 | 29.2 | 20.5 | 2.7 | 97.3 |
See also
 In Spanish: Municipio de Vingåker para niños


