Villamaría, Caldas facts for kids
This article is about Villa Maria (disambiguation)|Villa Maria. For other uses, see Villamaría, Caldas (disambiguation).
Quick facts for kids
Villamaría, Caldas
|
|||
|---|---|---|---|
|
Municipality and town
|
|||
 |
|||
|
|||

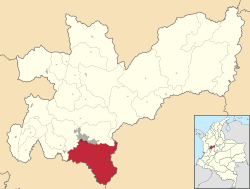
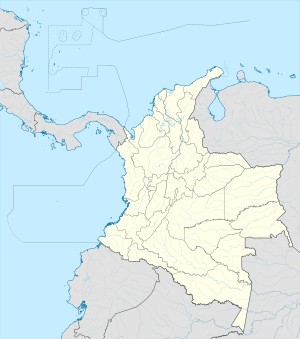
Location of the municipality and town of Villamaría, Caldas in the Caldas Department of Colombia.
|
|||
| Country | |||
| Department | |||
| Founded | October 19, 1852 | ||
| Area | |||
| • Municipality and town | 455.1 km2 (175.7 sq mi) | ||
| • Urban | 4.83 km2 (1.86 sq mi) | ||
| Elevation | 1,920 m (6,300 ft) | ||
| Population
(2018 census)
|
|||
| • Municipality and town | 64,652 | ||
| • Density | 142.061/km2 (367.94/sq mi) | ||
| • Urban | 55,894 | ||
| • Urban density | 11,572/km2 (29,972/sq mi) | ||
| Demonym(s) | Villamariano | ||
| Time zone | UTC-5 (Colombia Standard Time) | ||
| Area code(s) | 57 + 6 | ||
| Website | Official website: http://www.villamaria-caldas.gov.co/ | ||
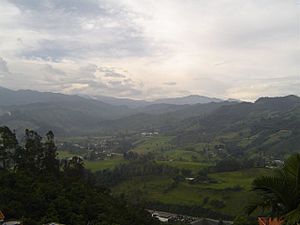
Villamaría is a town and municipality in the Colombian Department of Caldas. Located in the Colombian coffee growing axis, it was made part of the "Coffee Cultural Landscape" UNESCO World Heritage Site in 2011.
Climate
The city of Villamaría and the lower parts of the municipality have a subtropical highland climate (Köppen Cfb).
| Climate data for Villamaría | |||||||||||||
|---|---|---|---|---|---|---|---|---|---|---|---|---|---|
| Month | Jan | Feb | Mar | Apr | May | Jun | Jul | Aug | Sep | Oct | Nov | Dec | Year |
| Mean daily maximum °C (°F) | 22.8 (73.0) |
22.8 (73.0) |
22.7 (72.9) |
22.0 (71.6) |
22.0 (71.6) |
21.8 (71.2) |
22.7 (72.9) |
22.5 (72.5) |
22.1 (71.8) |
21.3 (70.3) |
21.4 (70.5) |
22.0 (71.6) |
22.2 (71.9) |
| Daily mean °C (°F) | 17.7 (63.9) |
17.8 (64.0) |
18.1 (64.6) |
17.7 (63.9) |
17.9 (64.2) |
17.5 (63.5) |
17.8 (64.0) |
17.8 (64.0) |
17.4 (63.3) |
17.0 (62.6) |
17.0 (62.6) |
17.3 (63.1) |
17.6 (63.6) |
| Mean daily minimum °C (°F) | 12.6 (54.7) |
12.9 (55.2) |
13.5 (56.3) |
13.4 (56.1) |
13.8 (56.8) |
13.3 (55.9) |
12.9 (55.2) |
13.1 (55.6) |
12.8 (55.0) |
12.8 (55.0) |
12.7 (54.9) |
12.7 (54.9) |
13.0 (55.5) |
| Average rainfall mm (inches) | 110.4 (4.35) |
116.5 (4.59) |
160.5 (6.32) |
213.9 (8.42) |
224.8 (8.85) |
154.1 (6.07) |
98.3 (3.87) |
95.5 (3.76) |
159.1 (6.26) |
249.8 (9.83) |
232.8 (9.17) |
138.5 (5.45) |
1,954.2 (76.94) |
| Average rainy days (≥ 1 mm) | 11 | 12 | 16 | 20 | 20 | 17 | 12 | 11 | 16 | 20 | 19 | 12 | 186 |
While the higher parts of the municipality have an alpine tundra climate (ETH) and the highest part has an ice cap climate (EFH).
| Climate data for Las Brisas | |||||||||||||
|---|---|---|---|---|---|---|---|---|---|---|---|---|---|
| Month | Jan | Feb | Mar | Apr | May | Jun | Jul | Aug | Sep | Oct | Nov | Dec | Year |
| Mean daily maximum °C (°F) | 8.6 (47.5) |
8.5 (47.3) |
8.7 (47.7) |
8.5 (47.3) |
8.5 (47.3) |
8.7 (47.7) |
8.6 (47.5) |
8.6 (47.5) |
8.3 (46.9) |
7.7 (45.9) |
8.0 (46.4) |
8.4 (47.1) |
8.4 (47.2) |
| Daily mean °C (°F) | 4.4 (39.9) |
4.6 (40.3) |
4.8 (40.6) |
5.0 (41.0) |
5.1 (41.2) |
4.9 (40.8) |
4.5 (40.1) |
4.5 (40.1) |
4.4 (39.9) |
4.4 (39.9) |
4.4 (39.9) |
4.5 (40.1) |
4.6 (40.3) |
| Mean daily minimum °C (°F) | 0.8 (33.4) |
1.0 (33.8) |
1.2 (34.2) |
1.8 (35.2) |
1.9 (35.4) |
1.5 (34.7) |
0.9 (33.6) |
0.9 (33.6) |
1.0 (33.8) |
1.3 (34.3) |
1.5 (34.7) |
1.0 (33.8) |
1.2 (34.2) |
| Average rainfall mm (inches) | 85.7 (3.37) |
83.3 (3.28) |
116.7 (4.59) |
178.0 (7.01) |
189.3 (7.45) |
112.3 (4.42) |
70.7 (2.78) |
73.2 (2.88) |
114.7 (4.52) |
192.2 (7.57) |
145.7 (5.74) |
86.7 (3.41) |
1,448.5 (57.02) |
| Average rainy days | 14.3 | 15.7 | 19.9 | 23.1 | 23.3 | 20.7 | 17.9 | 17.5 | 18.9 | 24.7 | 22.8 | 17.8 | 236.6 |
| Average relative humidity (%) | 89.3 | 91.7 | 91.8 | 93.6 | 93.4 | 92.2 | 90.5 | 91.2 | 91.8 | 92.7 | 92.2 | 90.5 | 91.7 |
| Mean monthly sunshine hours | 97.6 | 85.1 | 71.9 | 46.0 | 53.7 | 72.6 | 102.6 | 98.4 | 62.4 | 44.8 | 62.4 | 82.8 | 880.3 |
| Mean daily sunshine hours | 3.1 | 3.0 | 2.3 | 1.5 | 1.7 | 2.4 | 3.3 | 3.2 | 2.1 | 1.4 | 2.1 | 2.7 | 2.4 |
See also
 In Spanish: Villamaría para niños

All content from Kiddle encyclopedia articles (including the article images and facts) can be freely used under Attribution-ShareAlike license, unless stated otherwise. Cite this article:
Villamaría, Caldas Facts for Kids. Kiddle Encyclopedia.


