South Salem, Ohio facts for kids
Quick facts for kids
South Salem, Ohio
|
|
|---|---|
|
Village
|
|

|
|

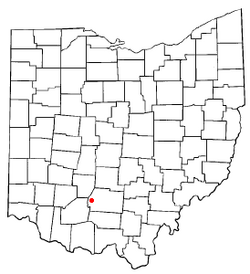
Location of South Salem, Ohio
|
|

Location of South Salem in Ross County
|
|
| Country | United States |
| State | Ohio |
| County | Ross |
| Area | |
| • Total | 0.18 sq mi (0.47 km2) |
| • Land | 0.18 sq mi (0.47 km2) |
| • Water | 0.00 sq mi (0.00 km2) |
| Elevation | 925 ft (282 m) |
| Population
(2020)
|
|
| • Total | 219 |
| • Density | 1,216.67/sq mi (469.94/km2) |
| Time zone | UTC-5 (Eastern (EST)) |
| • Summer (DST) | UTC-4 (EDT) |
| ZIP code |
45681
|
| Area code(s) | 740 |
| FIPS code | 39-73698 |
| GNIS feature ID | 2399858 |
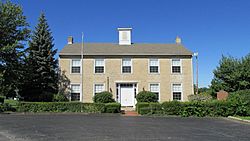
South Salem is a village in Ross County, Ohio, United States. The population was 219 at the 2020 census.
Contents
History
In 1842, local Presbyterian minister Hugh Stewart Fullerton orchestrated the establishment of a school in southwestern Ross County. Known as the "Salem Academy," this school became the foundation of the present village: landowner John Sample platted South Salem in 1846 in order better to serve the students and teachers of the school. After two years of rapid growth, the village reached the point that it could easily serve the needs of the school, and growth ceased. Although South Salem incorporated in the 1870s, few other changes occurred during the late years of the nineteenth century. In 1917, its population was deemed to be between 350 and 400 residents, a size that had remained consistent since the 1850s. The Salem Academy (by then known as the "South Salem Academy") closed in 1907 due to competition from other schools, and since that time, the village has declined in population.
Geography
According to the United States Census Bureau, the village has a total area of 0.21 square miles (0.54 km2), all land.
Demographics
| Historical population | |||
|---|---|---|---|
| Census | Pop. | %± | |
| 1850 | 479 | — | |
| 1860 | 318 | −33.6% | |
| 1880 | 299 | — | |
| 1890 | 263 | −12.0% | |
| 1900 | 264 | 0.4% | |
| 1910 | 211 | −20.1% | |
| 1920 | 193 | −8.5% | |
| 1930 | 201 | 4.1% | |
| 1940 | 185 | −8.0% | |
| 1950 | 206 | 11.4% | |
| 1960 | 180 | −12.6% | |
| 1970 | 209 | 16.1% | |
| 1980 | 252 | 20.6% | |
| 1990 | 227 | −9.9% | |
| 2000 | 213 | −6.2% | |
| 2010 | 204 | −4.2% | |
| 2020 | 219 | 7.4% | |
| U.S. Decennial Census | |||
2010 census
As of the census of 2010, there were 204 people, 80 households, and 58 families residing in the village. The population density was 971.4 inhabitants per square mile (375.1/km2). There were 84 housing units at an average density of 400.0 per square mile (154.4/km2). The racial makeup of the village was 98.5% White, 1.0% African American, and 0.5% from two or more races.
There were 80 households, of which 35.0% had children under the age of 18 living with them, 55.0% were married couples living together, 13.8% had a female householder with no husband present, 3.8% had a male householder with no wife present, and 27.5% were non-families. 21.3% of all households were made up of individuals, and 7.6% had someone living alone who was 65 years of age or older. The average household size was 2.55 and the average family size was 2.90.
The median age in the village was 42 years. 23% of residents were under the age of 18; 5.8% were between the ages of 18 and 24; 27.5% were from 25 to 44; 31.3% were from 45 to 64; and 12.3% were 65 years of age or older. The gender makeup of the village was 49.0% male and 51.0% female.
See also
 In Spanish: South Salem (Ohio) para niños

