Soda Springs, Nevada County, California facts for kids
Quick facts for kids
Soda Springs
|
|
|---|---|

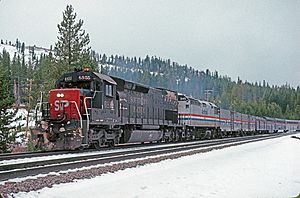
The Amtrak San Francisco Zephyr at Soda Springs
|
|
| Country | |
| State | |
| County | Nevada |
| Area | |
| • Total | 0.339 sq mi (0.879 km2) |
| • Land | 0.339 sq mi (0.879 km2) |
| • Water | 0 sq mi (0 km2) 0% |
| Elevation | 6,768 ft (2,063 m) |
| Population
(2010)
|
|
| • Total | 81 |
| • Density | 238.9/sq mi (92.2/km2) |
| Time zone | UTC-8 (Pacific (PST)) |
| • Summer (DST) | UTC-7 (PDT) |
| ZIP code |
95728, 95724
|
| Area code(s) | 530 |
| GNIS feature IDs | 234848; 2628790 |
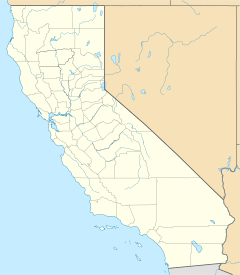
Soda Springs (formerly, Summit Valley, Soda Springs Station, Hopkins, Hopkins Springs, and Tinkers Station) is an unincorporated community and census-designated place (CDP) in Nevada County, California, United States. Soda Springs is located 3 miles (4.8 km) west of Donner Pass. The population was 81 at the 2010 census.
The Soda Springs Ski Resort is located just off Highway 80 near the Donner Summit.
Contents
History
Mark Hopkins and Leland Stanford established a resort at the location in the 1880s.
The Summit Valley post office opened in 1870, changed its name to Soda Springs in 1875, and closed in 1881. It was reopened in 1929. The Hopkins post office operated from 1885 to 1886. Alternately it was reportedly known as Hopkins Springs until the Soda Springs post office was established on March 8, 1875.
The Central Pacific Railroad station was named Tinkers Station from 1867 to 1873, commemorating J.A. Tinker. Tinker was a "rough, hard-driving, hard-drinking teamster" who hauled freight between the mines on Forest Hill Divide and Soda Springs.
Geography
According to the United States Census Bureau, the CDP covers an area of 0.3 square miles (0.9 km2), all of it land
Climate
Soda Springs has a dry-summer continental climate (Köppen climate classification Dsb) that is characterized by warm, dry summers, and cold, extremely snowy winters. Snow depth peaks at 93 inches (236.2 cm) during March. Soda Springs is listed as the snowiest place in the state of California and one of the snowiest census-designated places in the world.
| Climate data for Soda Springs, California, 1991–2020 normals, extremes 1913–1959 | |||||||||||||
|---|---|---|---|---|---|---|---|---|---|---|---|---|---|
| Month | Jan | Feb | Mar | Apr | May | Jun | Jul | Aug | Sep | Oct | Nov | Dec | Year |
| Record high °F (°C) | 61 (16) |
65 (18) |
64 (18) |
72 (22) |
79 (26) |
88 (31) |
91 (33) |
88 (31) |
92 (33) |
78 (26) |
72 (22) |
67 (19) |
92 (33) |
| Mean maximum °F (°C) | 52.9 (11.6) |
54.0 (12.2) |
57.7 (14.3) |
63.7 (17.6) |
71.2 (21.8) |
79.3 (26.3) |
84.5 (29.2) |
83.0 (28.3) |
80.3 (26.8) |
73.0 (22.8) |
64.5 (18.1) |
58.0 (14.4) |
85.9 (29.9) |
| Mean daily maximum °F (°C) | 36.9 (2.7) |
39.2 (4.0) |
42.9 (6.1) |
49.5 (9.7) |
55.9 (13.3) |
64.4 (18.0) |
73.8 (23.2) |
73.4 (23.0) |
68.3 (20.2) |
57.9 (14.4) |
47.5 (8.6) |
40.7 (4.8) |
54.2 (12.3) |
| Daily mean °F (°C) | 24.9 (−3.9) |
26.5 (−3.1) |
30.0 (−1.1) |
36.7 (2.6) |
43.1 (6.2) |
51.1 (10.6) |
59.0 (15.0) |
57.7 (14.3) |
53.4 (11.9) |
44.8 (7.1) |
35.0 (1.7) |
28.1 (−2.2) |
40.9 (4.9) |
| Mean daily minimum °F (°C) | 12.6 (−10.8) |
13.6 (−10.2) |
17.1 (−8.3) |
23.9 (−4.5) |
30.3 (−0.9) |
37.8 (3.2) |
44.2 (6.8) |
42.0 (5.6) |
37.9 (3.3) |
31.0 (−0.6) |
22.0 (−5.6) |
15.3 (−9.3) |
27.3 (−2.6) |
| Mean minimum °F (°C) | −6.7 (−21.5) |
−7.3 (−21.8) |
−1.7 (−18.7) |
9.3 (−12.6) |
19.4 (−7.0) |
28.4 (−2.0) |
36.8 (2.7) |
34.9 (1.6) |
27.8 (−2.3) |
19.7 (−6.8) |
6.1 (−14.4) |
−4.3 (−20.2) |
−11.9 (−24.4) |
| Record low °F (°C) | −24 (−31) |
−28 (−33) |
−20 (−29) |
−10 (−23) |
2 (−17) |
21 (−6) |
23 (−5) |
24 (−4) |
20 (−7) |
6 (−14) |
−6 (−21) |
−17 (−27) |
−28 (−33) |
| Average precipitation inches (mm) | 13.16 (334) |
12.26 (311) |
12.14 (308) |
6.99 (178) |
4.74 (120) |
1.57 (40) |
0.43 (11) |
0.45 (11) |
0.99 (25) |
3.89 (99) |
7.57 (192) |
14.35 (364) |
78.54 (1,993) |
| Average snowfall inches (cm) | 73.0 (185) |
84.2 (214) |
105.7 (268) |
41.2 (105) |
15.6 (40) |
1.8 (4.6) |
0.0 (0.0) |
0.0 (0.0) |
1.5 (3.8) |
9.9 (25) |
42.8 (109) |
69.3 (176) |
445.0 (1,130) |
| Average extreme snow depth inches (cm) | 74 (190) |
90 (230) |
108 (270) |
90 (230) |
46 (120) |
15 (38) |
0 (0) |
0 (0) |
1 (2.5) |
6 (15) |
17 (43) |
49 (120) |
118 (300) |
| Average precipitation days (≥ 0.01 in) | 12.2 | 11.6 | 15.9 | 11.2 | 10.8 | 5.5 | 1.8 | 2.8 | 3.8 | 5.9 | 9.3 | 14.1 | 104.9 |
| Average snowy days (≥ 0.1 in) | 10.0 | 10.6 | 13.5 | 7.7 | 3.6 | 0.7 | 0.0 | 0.0 | 0.6 | 1.8 | 6.7 | 11.5 | 66.7 |
| Source: NOAA | |||||||||||||
Demographics
The 2010 United States Census reported that Soda Springs had a population of 81. The population density was 238.6 inhabitants per square mile (92.1/km2). The racial makeup of Soda Springs was 79 (97.5%) White, 0 (0.0%) African American, 2 (2.5%) Native American, 0 (0.0%) Asian, 0 (0.0%) Pacific Islander, 0 (0.0%) from other races, and 0 (0.0%) from two or more races. Hispanic or Latino of any race were 7 persons (8.6%).
The Census reported that 81 people (100% of the population) lived in households, 0 (0%) lived in non-institutionalized group quarters, and 0 (0%) were institutionalized.
There were 41 households, out of which 6 (14.6%) had children under the age of 18 living in them, 8 (19.5%) were opposite-sex married couples living together, 2 (4.9%) had a female householder with no husband present, 5 (12.2%) had a male householder with no wife present. There were 3 (7.3%) unmarried opposite-sex partnerships, and 0 (0%) same-sex married couples or partnerships. 17 households (41.5%) were made up of individuals, and 1 (2.4%) had someone living alone who was 65 years of age or older. The average household size was 1.98. There were 15 families (36.6% of all households); the average family size was 2.33.
The population was spread out, with 9 people (11.1%) under the age of 18, 9 people (11.1%) aged 18 to 24, 34 people (42.0%) aged 25 to 44, 21 people (25.9%) aged 45 to 64, and 8 people (9.9%) who were 65 years of age or older. The median age was 35.8 years. For every 100 females, there were 211.5 males. For every 100 females age 18 and over, there were 200.0 males.
There were 136 housing units at an average density of 400.6 per square mile (154.7/km2), of which 21 (51.2%) were owner-occupied, and 20 (48.8%) were occupied by renters. The homeowner vacancy rate was 4.5%; the rental vacancy rate was 4.8%. 42 people (51.9% of the population) lived in owner-occupied housing units and 39 people (48.1%) lived in rental housing units.
See also
 In Spanish: Soda Springs (California) para niños


