Size-exclusion chromatography facts for kids

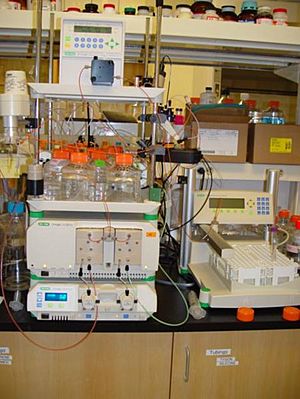
Equipment for running size-exclusion chromatography. The buffer is pumped through the column (right) by a computer-controlled device
|
|
| Acronym | SEC |
|---|---|
| Classification | Chromatography |
| Analytes | macromolecules synthetic polymers biomolecules |
| Manufacturers | GE, Bio-Rad, Knauer, emp Biotech |
| Other techniques | |
| Related | High-performance liquid chromatography Aqueous normal-phase chromatography Ion exchange chromatography Micellar liquid chromatography |
The popular separation method called Size-Exclusion Chromatography (SEC) separates components of mixture based on the size. Recall a mixture can be composed of many substances each with different physical and chemical properties which can be used to differentiate them. SEC essentially allows components that are larger in size to exit the column (elute) first while components that are smaller in size will exit the column last.
A typical column used in SEC has two substances called phases that interact with the mixture and these substances help force the separation of the mixture. The mobile phase is a solvent which helps carry the mixture down the column, and the stationary phase which does not move. Unlike other chromatography methods, the stationary phase used in SEC does not exploit the polarity of each component. It is worth noting there is no chemical interaction between the stationary phase and a component. A column could be packed with two types of stationary phase material. First the stationary phase could be a porous solid. A common porous solid is silica which has a diameter of 5-10µm and a pore sizes ranging from 100-1000Å. Silica provides excellent rigidity and will not move throughout the column. Porous solids are also stable at high pressures and temperatures which allows for the use of a vast variety of solvents. Unfortunately silica particles have a tendency to allow absorb soluble components and they have the capacity to break down components into atoms. For these reasons columns could also be packed with porous gels. The structure of gel is vastly different from a porous solid because gel’s have a polymer-like (a repeating structure of the same substance) structure. Gels have been shown to be more effective than porous solids at allowing components through its pores. Gels have pore sizes ranging from 100-100000Å. So how is it that larger molecules exit the column before smaller molecules?
The porous material will not allow larger molecules to pass so these molecules go to the next pore and again they cannot pass. They eventually get to the bottom of the column and exit the column. Remember there is volume inside the column that is not inhabited by the stationary phase which allows for the flow of both the mobile phase and the sample. These larger molecules then find themselves at the bottom of the column whereas smaller molecules have a longer path to travel. Smaller molecules can pass through a pore and then pass through another one. The smaller a molecule is, the greater the chance is that it can fit into a pore which means the longer it spends inside the column.
Reading a Chromatogram
Notice the graph is logarithmic not linear. There at two distinct positions on the curve the exclusion limit and the permeation limit. The exclusion limit defines the maximum molecular weight that can enter a pore, while the permeation limit signifies the minimum molecular weight to enter a pore. The curve itself is called the permeation region and this provides a range of molecular weights which could be found in the experiment. Retention time, how long the component spends in the column, is plotted against molecular weight. The peaks located in Figures 1 and 2 are similar to peaks liquid or gas chromatography readout. Normally peaks found in liquid or gas chromatography indicates how many components are in a mixture if the number of components is unknown and the relative amount of each component in the mixture within a given range. In the case of SEC these peaks indicate the relative amount of each component (based on molecular weight) within the permeation region.
Advantages/Disadvantages
SEC has several advantages and disadvantages. First in SEC the time it takes the mixture to exit the column can be controlled. Depending on the chemical characteristics of the mixture and its components the process could be quick or slow. Second the peaks are well-defined, sharp, and narrow. All characteristics indicate SCE provides good sensitivity. Next there is low mass loss since the sample theoretically is not supposed to come interact with the stationary phase. Last the stability of the stationary phase allows close packing to provide greater separation of components in the sample.
A clear disadvantage to SEC is with short retention times the peaks overlap and little information could be extracted from such data. Resolution (how well two peaks can two peaks be distinguished between) must be sacrificed if the process is to be shorter in time. SEC does not provide data to distinguish between components of similar molecular mass. For example if component A has molecular mass equal to 900 g/mol and component B has molecular mass equal to 950 g/mol, SEC will show one peak in this region and both components will be represented by the same peak. To have statistically different peaks there should be a 10% difference between molecular weight. Also lumped into this category are enantiomers and diastereomers which are molecules of the same molecular weight but have slightly different structures. Last SEC fails to take into account for a component’s viscosity or resistance to flow.
Images for kids


