Santa Rosa, Texas facts for kids
Quick facts for kids
Santa Rosa, Texas
|
|
|---|---|

Location of Santa Rosa, Texas
|
|
 |
|
| Country | United States |
| State | Texas |
| County | Cameron |
| Area | |
| • Total | 0.77 sq mi (2.00 km2) |
| • Land | 0.77 sq mi (2.00 km2) |
| • Water | 0.00 sq mi (0.00 km2) |
| Elevation | 49 ft (15 m) |
| Population
(2020)
|
|
| • Total | 2,450 |
| • Density | 3,182/sq mi (1,225/km2) |
| Time zone | UTC-6 (Central (CST)) |
| • Summer (DST) | UTC-5 (CDT) |
| ZIP code |
78593
|
| Area code(s) | 956 |
| FIPS code | 48-65768 |
| GNIS feature ID | 1346669 |
Santa Rosa is a town in Cameron County, Texas, United States. The population was 2,450 at the 2020 census. It is part of the Brownsville–Harlingen–Raymondville and the Matamoros–Brownsville metropolitan areas.
Contents
Geography
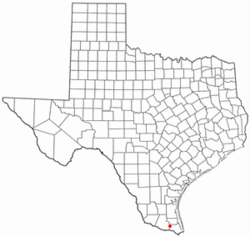
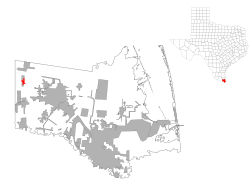
Santa Rosa is located in northwestern Cameron County at 26°15′24″N 97°49′36″W / 26.25667°N 97.82667°W (26.256651, –97.826673). It is 6 miles (10 km) west of Combes and 7 miles (11 km) east of La Villa.
According to the United States Census Bureau, the town has a total area of 0.77 square miles (2.0 km2), all land.
Climate
According to the Köppen Climate Classification system, Santa Rosa has a humid subtropical climate, abbreviated "Cfa" on climate maps. The hottest temperature recorded in Santa Rosa was 107 °F (41.7 °C) on September 6, 2000, and June 24, 2017, while the coldest temperature recorded was 16 °F (−8.9 °C) on December 23, 1989.
| Climate data for Santa Rosa, Texas, 1991–2020 normals, extremes 1987–present | |||||||||||||
|---|---|---|---|---|---|---|---|---|---|---|---|---|---|
| Month | Jan | Feb | Mar | Apr | May | Jun | Jul | Aug | Sep | Oct | Nov | Dec | Year |
| Record high °F (°C) | 93 (34) |
98 (37) |
102 (39) |
106 (41) |
105 (41) |
107 (42) |
105 (41) |
105 (41) |
107 (42) |
103 (39) |
99 (37) |
92 (33) |
107 (42) |
| Mean maximum °F (°C) | 86.3 (30.2) |
90.3 (32.4) |
94.3 (34.6) |
96.4 (35.8) |
97.3 (36.3) |
100.2 (37.9) |
101.0 (38.3) |
102.0 (38.9) |
99.7 (37.6) |
96.3 (35.7) |
91.4 (33.0) |
87.1 (30.6) |
103.2 (39.6) |
| Mean daily maximum °F (°C) | 71.3 (21.8) |
75.7 (24.3) |
80.9 (27.2) |
86.4 (30.2) |
90.6 (32.6) |
94.9 (34.9) |
96.3 (35.7) |
97.4 (36.3) |
92.6 (33.7) |
88.0 (31.1) |
79.7 (26.5) |
72.9 (22.7) |
85.6 (29.8) |
| Daily mean °F (°C) | 60.4 (15.8) |
64.4 (18.0) |
69.7 (20.9) |
75.3 (24.1) |
80.7 (27.1) |
84.8 (29.3) |
86.0 (30.0) |
86.4 (30.2) |
82.3 (27.9) |
76.6 (24.8) |
68.4 (20.2) |
61.6 (16.4) |
74.7 (23.7) |
| Mean daily minimum °F (°C) | 48.8 (9.3) |
53.2 (11.8) |
58.4 (14.7) |
64.2 (17.9) |
70.8 (21.6) |
74.7 (23.7) |
75.7 (24.3) |
75.4 (24.1) |
72.0 (22.2) |
65.2 (18.4) |
57.0 (13.9) |
50.2 (10.1) |
63.8 (17.7) |
| Mean minimum °F (°C) | 34.5 (1.4) |
37.4 (3.0) |
42.1 (5.6) |
48.8 (9.3) |
58.6 (14.8) |
69.1 (20.6) |
71.5 (21.9) |
71.3 (21.8) |
63.1 (17.3) |
49.2 (9.6) |
40.6 (4.8) |
34.6 (1.4) |
31.8 (−0.1) |
| Record low °F (°C) | 25 (−4) |
22 (−6) |
30 (−1) |
38 (3) |
50 (10) |
63 (17) |
67 (19) |
66 (19) |
54 (12) |
32 (0) |
32 (0) |
16 (−9) |
16 (−9) |
| Average precipitation inches (mm) | 1.12 (28) |
1.00 (25) |
1.40 (36) |
1.39 (35) |
2.48 (63) |
2.88 (73) |
1.67 (42) |
2.10 (53) |
5.56 (141) |
2.66 (68) |
1.23 (31) |
1.12 (28) |
24.61 (623) |
| Average snowfall inches (cm) | 0.0 (0.0) |
0.0 (0.0) |
0.0 (0.0) |
0.0 (0.0) |
0.0 (0.0) |
0.0 (0.0) |
0.0 (0.0) |
0.0 (0.0) |
0.0 (0.0) |
0.0 (0.0) |
0.0 (0.0) |
0.1 (0.25) |
0.1 (0.25) |
| Average precipitation days (≥ 0.01 in) | 7.0 | 5.5 | 5.8 | 4.7 | 4.6 | 5.2 | 3.8 | 5.2 | 9.4 | 6.1 | 5.7 | 7.2 | 70.2 |
| Average snowy days (≥ 0.1 in) | 0.0 | 0.0 | 0.0 | 0.0 | 0.0 | 0.0 | 0.0 | 0.0 | 0.0 | 0.0 | 0.0 | 0.0 | 0.0 |
| Source 1: NOAA | |||||||||||||
| Source 2: National Weather Service | |||||||||||||
Demographics
| Historical population | |||
|---|---|---|---|
| Census | Pop. | %± | |
| 1930 | 737 | — | |
| 1940 | 224 | −69.6% | |
| 1950 | 400 | 78.6% | |
| 1960 | 1,572 | 293.0% | |
| 1970 | 1,466 | −6.7% | |
| 1980 | 1,889 | 28.9% | |
| 1990 | 2,223 | 17.7% | |
| 2000 | 2,833 | 27.4% | |
| 2010 | 2,873 | 1.4% | |
| 2020 | 2,450 | −14.7% | |
| U.S. Decennial Census | |||
2020 census
| Race | Number | Percentage |
|---|---|---|
| White (NH) | 66 | 2.69% |
| Black or African American (NH) | 1 | 0.04% |
| Native American or Alaska Native (NH) | 2 | 0.08% |
| Asian (NH) | 4 | 0.16% |
| Pacific Islander (NH) | 1 | 0.04% |
| Some Other Race (NH) | 1 | 0.04% |
| Mixed/Multi-Racial (NH) | 7 | 0.29% |
| Hispanic or Latino | 2,368 | 96.65% |
| Total | 2,450 |
As of the 2020 United States census, there were 2,450 people, 842 households, and 659 families residing in the town.
Education
The Santa Rosa Independent School District operates Santa Rosa High School, Santa Rosa Middle School, and an elementary/preschool.
In addition, South Texas Independent School District operates magnet schools that serve the community.
See also
 In Spanish: Santa Rosa (condado de Cameron, Texas) para niños

