
Söderköping Municipality facts for kids
Quick facts for kids
Söderköping Municipality
Söderköpings kommun
|
||
|---|---|---|
 |
||
|
||
 |
||
| Country | Sweden | |
| County | Östergötland County | |
| Seat | Söderköping | |
| Area | ||
| • Total | 1,329.47 km2 (513.31 sq mi) | |
| • Land | 677.92 km2 (261.75 sq mi) | |
| • Water | 651.55 km2 (251.56 sq mi) | |
| Area as of January 1, 2010. | ||
| Population
(June 30, 2012)
|
||
| • Total | 14,062 | |
| • Density | 10.5771/km2 (27.3947/sq mi) | |
| Time zone | UTC+1 (CET) | |
| • Summer (DST) | UTC+2 (CEST) | |
| ISO 3166 code | SE | |
| Province | Östergötland | |
| Municipal code | 0582 | |
| Website | www.soderkoping.se | |

Söderköping Municipality (Söderköpings kommun) is a municipality in Östergötland County in southeast Sweden. Its seat is located in the city of Söderköping.
The present municipality was created in 1971-1973 when the former City of Söderköping in two steps was amalgamated with three surrounding rural municipalities.
Contents
Demographics
This is a demographic table based on Söderköping Municipality's electoral districts in the 2022 Swedish general election sourced from SVT's election platform, in turn taken from SCB official statistics.
In total there were 11,419 Swedish citizens of voting age resident in the municipality. 39.3% voted for the left coalition and 59.6% for the right coalition. Indicators are in percentage points except population totals and income.
| Location | Residents | Citizen adults |
Left vote | Right vote | Employed | Swedish parents |
Foreign heritage |
Income SEK |
Degree |
|---|---|---|---|---|---|---|---|---|---|
| % | % | ||||||||
| Alboga | 1,626 | 1,167 | 43.9 | 55.0 | 79 | 85 | 15 | 24,399 | 33 |
| Bossgård | 1,850 | 1,462 | 44.7 | 54.1 | 78 | 90 | 10 | 22,949 | 36 |
| Drothem | 2,183 | 1,666 | 39.7 | 59.5 | 89 | 93 | 7 | 29,811 | 46 |
| S:t Laurentii | 1,742 | 1,439 | 41.3 | 57.0 | 81 | 89 | 11 | 25,086 | 38 |
| Sankt Anna-Börrum | 781 | 715 | 37.0 | 62.0 | 80 | 95 | 5 | 24,053 | 32 |
| Skällvik-Mogata | 1,471 | 1,170 | 33.7 | 65.4 | 87 | 93 | 7 | 27,171 | 34 |
| Skönberga | 1,885 | 1,471 | 38.6 | 60.3 | 81 | 90 | 10 | 24,385 | 30 |
| V Husby-Gårdeby | 2,064 | 1,527 | 35.6 | 63.2 | 87 | 94 | 6 | 29,020 | 38 |
| Östra Ryd | 1,064 | 802 | 38.3 | 61.3 | 87 | 94 | 6 | 26,170 | 35 |
| Source: SVT | |||||||||
Elections
Riksdag
These are the results of the Riksdag elections of Söderköping Municipality since the 1972 municipality reform. The results of the Sweden Democrats were not published by SCB between 1988 and 1998 at a municipal level to the party's small nationwide size at the time. "Turnout" denotes the percentage of the electorate casting a ballot, whereas "Votes" only denotes valid votes.
| Year | Turnout | Votes | V | S | MP | C | L | KD | M | SD | ND |
|---|---|---|---|---|---|---|---|---|---|---|---|
| 1973 | 92.3 | 6,457 | 2.1 | 35.4 | 0.0 | 38.0 | 6.0 | 3.0 | 15.3 | 0.0 | 0.0 |
| 1976 | 92.6 | 6,954 | 1.7 | 33.2 | 0.0 | 37.4 | 8.3 | 1.9 | 17.3 | 0.0 | 0.0 |
| 1979 | 91.6 | 7,272 | 2.6 | 33.9 | 0.0 | 31.4 | 7.6 | 1.8 | 22.0 | 0.0 | 0.0 |
| 1982 | 92.1 | 7,749 | 3.0 | 36.6 | 1.5 | 27.2 | 4.4 | 2.0 | 25.3 | 0.0 | 0.0 |
| 1985 | 90.4 | 7,978 | 2.5 | 36.4 | 2.1 | 23.7 | 11.8 | 0.0 | 23.5 | 0.0 | 0.0 |
| 1988 | 86.3 | 7,933 | 3.1 | 36.3 | 6.9 | 21.7 | 9.8 | 3.3 | 18.9 | 0.0 | 0.0 |
| 1991 | 87.7 | 8,455 | 2.6 | 30.1 | 3.7 | 15.6 | 6.7 | 8.3 | 23.1 | 0.0 | 8.7 |
| 1994 | 87.5 | 8,711 | 3.8 | 38.7 | 5.9 | 13.9 | 4.7 | 4.5 | 25.6 | 0.0 | 1.8 |
| 1998 | 83.1 | 8,362 | 8.9 | 31.6 | 5.1 | 6.3 | 3.7 | 15.4 | 26.3 | 0.0 | 0.0 |
| 2002 | 82.1 | 8,514 | 5.7 | 35.3 | 5.3 | 10.4 | 10.2 | 11.4 | 19.0 | 1.3 | 0.0 |
| 2006 | 84.1 | 8,890 | 4.4 | 30.9 | 5.3 | 11.7 | 5.3 | 7.6 | 28.6 | 2.7 | 0.0 |
| 2010 | 85.8 | 9,336 | 4.2 | 26.2 | 7.1 | 10.0 | 5.9 | 6.6 | 33.7 | 5.0 | 0.0 |
| 2014 | 88.3 | 9,826 | 3.8 | 27.0 | 5.8 | 8.7 | 4.3 | 5.0 | 26.0 | 16.5 | 0.0 |
Blocs
This lists the relative strength of the socialist and centre-right blocs since 1973, but parties not elected to the Riksdag are inserted as "other", including the Sweden Democrats results from 1988 to 2006, but also the Christian Democrats pre-1991 and the Greens in 1982, 1985 and 1991. The sources are identical to the table above. The coalition or government mandate marked in bold formed the government after the election. New Democracy got elected in 1991 but are still listed as "other" due to the short lifespan of the party. "Elected" is the total number of percentage points from the municipality that went to parties who were elected to the Riksdag.
| Year | Turnout | Votes | Left | Right | SD | Other | Elected |
|---|---|---|---|---|---|---|---|
| 1973 | 92.3 | 6,457 | 37.5 | 59.3 | 0.0 | 3.2 | 96.8 |
| 1976 | 92.6 | 6,954 | 34.9 | 63.0 | 0.0 | 2.1 | 97.9 |
| 1979 | 91.6 | 7,272 | 36.5 | 61.0 | 0.0 | 2.5 | 97.5 |
| 1982 | 92.1 | 7,749 | 39.6 | 57.1 | 0.0 | 3.3 | 96.7 |
| 1985 | 90.4 | 7,978 | 38.9 | 59.0 | 0.0 | 2.1 | 97.9 |
| 1988 | 86.3 | 7,933 | 46.3 | 50.4 | 0.0 | 3.3 | 96.7 |
| 1991 | 87.7 | 8,455 | 32.7 | 53.7 | 0.0 | 13.6 | 95.1 |
| 1994 | 87.5 | 8,711 | 48.4 | 48.7 | 0.0 | 2.9 | 97.1 |
| 1998 | 83.1 | 8,362 | 45.6 | 51.7 | 0.0 | 2.7 | 97.3 |
| 2002 | 82.1 | 8,514 | 46.3 | 51.0 | 0.0 | 2.7 | 97.3 |
| 2006 | 84.1 | 8,890 | 40.6 | 53.2 | 0.0 | 6.2 | 93.8 |
| 2010 | 85.8 | 9,336 | 37.5 | 56.2 | 5.0 | 1.3 | 98.7 |
| 2014 | 88.3 | 9,826 | 36.6 | 44.0 | 16.5 | 2.9 | 97.1 |
| 2018 | 88.1 | 9,855 | 48.5 | 35.0 | 14.0 | 2.4 | 97.6 |
Gallery
Images from the city of Söderköping:
-

Söderköping Town Hall
-
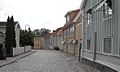
Munkebro Street, Söderköping
-
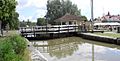
Söderköping lock on the Göta Canal


See also
 In Spanish: Municipio de Söderköping para niños
