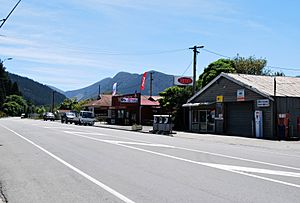
Rai Valley facts for kids
Quick facts for kids
Rai Valley
|
|
|---|---|
 |
|
| Country | New Zealand |
| District | Marlborough |
| Ward |
|
| Electorates |
|
| Area | |
| • Total | 27.96 km2 (10.80 sq mi) |
| Population
(June 2023)
|
|
| • Total | 190 |
| • Density | 6.80/km2 (17.6/sq mi) |
Rai Valley is a rural settlement in Marlborough, New Zealand. It is located on State Highway 6, 68 km (42 mi) northwest of Blenheim and 46 km (29 mi) east of Nelson. The Rai River runs past the locality to join the Pelorus River at the locality of Pelorus Bridge to the south. At the 2018 census, the settlement had a population of 177.
The area may have been named for the Rangitāne chief, Rai kau moana.
The locality supports dairy farming in the area, with a dairy and cheese factory established in about 1909.
Contents
History
The Valley was one of the last areas explored by Europeans in northern Marlborough. John Tinline discovered it while looking for a route to Nelson in January 1850.
The Rai Valley was densely forested in the 19th century. A township grew up at Carluke, just to the west of Rai Valley locality, around a sawmill built by William Brownlee in 1907. About 100 people worked at the mill, and a light railway connected it to a port on the Pelorus River.
Returned servicemen took up many local farms in 1919.
Demographics
Rai Valley is described by Statistics New Zealand as a rural settlement. It covers 27.96 km2 (10.80 sq mi) and had an estimated population of 190 as of June 2023, with a population density of 7 people per km2. It is part of the larger Marlborough Sounds West statistical area.
| Historical population | ||
|---|---|---|
| Year | Pop. | ±% p.a. |
| 2006 | 141 | — |
| 2013 | 147 | +0.60% |
| 2018 | 177 | +3.78% |
Rai Valley had a population of 177 at the 2018 New Zealand census, an increase of 30 people (20.4%) since the 2013 census, and an increase of 36 people (25.5%) since the 2006 census. There were 81 households, comprising 84 males and 96 females, giving a sex ratio of 0.88 males per female. The median age was 40.8 years (compared with 37.4 years nationally), with 45 people (25.4%) aged under 15 years, 21 (11.9%) aged 15 to 29, 75 (42.4%) aged 30 to 64, and 33 (18.6%) aged 65 or older.
Ethnicities were 93.2% European/Pākehā, 20.3% Māori, 3.4% Pasifika, and 1.7% other ethnicities. People may identify with more than one ethnicity.
Although some people chose not to answer the census's question about religious affiliation, 67.8% had no religion, 20.3% were Christian and 1.7% had other religions.
Of those at least 15 years old, 12 (9.1%) people had a bachelor's or higher degree, and 42 (31.8%) people had no formal qualifications. The median income was $28,600, compared with $31,800 nationally. 15 people (11.4%) earned over $70,000 compared to 17.2% nationally. The employment status of those at least 15 was that 60 (45.5%) people were employed full-time, 21 (15.9%) were part-time, and 3 (2.3%) were unemployed.
Education
Rai Valley Area School is a coeducational composite (years 1–13) school with a decile rating of 6 and a roll of 94.
Climate
| Climate data for Rai Valley (1981–2010 normals, extremes 1962–1987) | |||||||||||||
|---|---|---|---|---|---|---|---|---|---|---|---|---|---|
| Month | Jan | Feb | Mar | Apr | May | Jun | Jul | Aug | Sep | Oct | Nov | Dec | Year |
| Record high °C (°F) | 31.5 (88.7) |
33.6 (92.5) |
30.0 (86.0) |
25.7 (78.3) |
21.8 (71.2) |
19.2 (66.6) |
19.6 (67.3) |
18.8 (65.8) |
24.0 (75.2) |
25.3 (77.5) |
27.6 (81.7) |
28.7 (83.7) |
33.6 (92.5) |
| Mean daily maximum °C (°F) | 22.5 (72.5) |
23.2 (73.8) |
21.2 (70.2) |
18.2 (64.8) |
15.6 (60.1) |
12.7 (54.9) |
12.4 (54.3) |
13.8 (56.8) |
15.6 (60.1) |
17.1 (62.8) |
18.8 (65.8) |
20.7 (69.3) |
17.7 (63.8) |
| Daily mean °C (°F) | 16.7 (62.1) |
16.8 (62.2) |
15.6 (60.1) |
12.5 (54.5) |
10.1 (50.2) |
7.6 (45.7) |
6.8 (44.2) |
8.1 (46.6) |
10.2 (50.4) |
12.0 (53.6) |
13.4 (56.1) |
15.7 (60.3) |
12.1 (53.8) |
| Mean daily minimum °C (°F) | 10.9 (51.6) |
10.4 (50.7) |
9.9 (49.8) |
6.8 (44.2) |
4.6 (40.3) |
2.5 (36.5) |
1.2 (34.2) |
2.4 (36.3) |
4.8 (40.6) |
6.8 (44.2) |
8.0 (46.4) |
10.6 (51.1) |
6.6 (43.8) |
| Record low °C (°F) | 1.3 (34.3) |
0.7 (33.3) |
−3.0 (26.6) |
−4.1 (24.6) |
−6.9 (19.6) |
−7.6 (18.3) |
−7.8 (18.0) |
−6.6 (20.1) |
−5.2 (22.6) |
−4.4 (24.1) |
−2.0 (28.4) |
−0.7 (30.7) |
−7.8 (18.0) |
| Average rainfall mm (inches) | 140.8 (5.54) |
113.7 (4.48) |
152.1 (5.99) |
197.5 (7.78) |
193.8 (7.63) |
171.3 (6.74) |
176.5 (6.95) |
162.4 (6.39) |
141.0 (5.55) |
223.4 (8.80) |
164.2 (6.46) |
180.6 (7.11) |
2,017.3 (79.42) |
| Source: NIWA (rain 1971–2000) | |||||||||||||

