Port Mansfield, Texas facts for kids
Quick facts for kids
Port Mansfield, Texas
|
|
|---|---|
 |
|

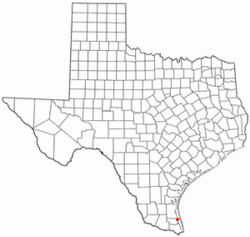
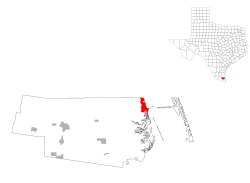
Location of Port Mansfield, Texas
|
|
 |
|
| Country | United States |
| State | Texas |
| County | Willacy |
| Area | |
| • Total | 5.7 sq mi (14.8 km2) |
| • Land | 5.2 sq mi (13.5 km2) |
| • Water | 0.5 sq mi (1.3 km2) |
| Elevation | 3 ft (1 m) |
| Population
(2020)
|
|
| • Total | 319 |
| • Density | 56.0/sq mi (21.55/km2) |
| Time zone | UTC-6 (Central (CST)) |
| • Summer (DST) | UTC-5 (CDT) |
| ZIP code |
78598
|
| Area code(s) | 956 |
| FIPS code | 48-58928 |
| GNIS feature ID | 1344369 |
Port Mansfield is a census-designated place (CDP) in Willacy County, Texas, United States. The population was 226 at the 2010 census.
Contents
Geography
Port Mansfield is located at 26°33′20″N 97°25′52″W / 26.55556°N 97.43111°W (26.555453, -97.431051).
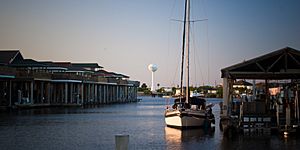
According to the United States Census Bureau, the CDP has a total area of 5.7 square miles (14.8 km2), of which 5.2 square miles (13.5 km2) is land and 0.5 square mile (1.3 km2) (8.76%) is water. A navigational channel connects Port Mansfield to the Intracoastal Waterway, and to the Gulf of Mexico, cutting through Padre Island via the Port Mansfield Channel.
The cut through South Padre Island had shoaled considerably in the early 2000s, and by 2008 only shallow draft boats could safely enter at the Mansfield cut. The channel was dredged in the winter months of 2009-2010 by the United States Army Corps of Engineers, using Federal relief money following hurricanes Rita and Dolly. The channel was dredged in the spring of 2021 and is now 16–20 feet deep, with all the dredge tailings making a beach on the north side of the jetty.
Demographics
| Historical population | |||
|---|---|---|---|
| Census | Pop. | %± | |
| 2020 | 319 | — | |
| U.S. Decennial Census 1850–1900 1910 1920 1930 1940 1950 1960 1970 1980 1990 2000 2010 |
|||
2020 census
| Race | Number | Percentage |
|---|---|---|
| White (NH) | 233 | 73.04% |
| Black or African American (NH) | 1 | 0.31% |
| Some Other Race (NH) | 1 | 0.31% |
| Mixed/Multi-Racial (NH) | 7 | 2.19% |
| Hispanic or Latino | 77 | 24.14% |
| Total | 319 |
As of the 2020 United States census, there were 319 people, 92 households, and 31 families residing in the CDP.
Climate
According to the Köppen Climate Classification system, Port Mansfield has a humid subtropical climate, abbreviated "Cfa" on climate maps. The hottest temperature recorded in Port Mansfield was 104 °F (40.0 °C) on May 11, 2006, while the coldest temperature recorded was 15 °F (−9.4 °C) on January 12, 1962 and December 23–24, 1989.
| Climate data for Port Mansfield, Texas, 1991–2020 normals, extremes 1958–present | |||||||||||||
|---|---|---|---|---|---|---|---|---|---|---|---|---|---|
| Month | Jan | Feb | Mar | Apr | May | Jun | Jul | Aug | Sep | Oct | Nov | Dec | Year |
| Record high °F (°C) | 92 (33) |
95 (35) |
101 (38) |
102 (39) |
104 (40) |
103 (39) |
102 (39) |
102 (39) |
102 (39) |
99 (37) |
98 (37) |
91 (33) |
104 (40) |
| Mean maximum °F (°C) | 81.6 (27.6) |
84.1 (28.9) |
87.0 (30.6) |
90.6 (32.6) |
91.3 (32.9) |
93.3 (34.1) |
94.7 (34.8) |
95.0 (35.0) |
94.3 (34.6) |
90.4 (32.4) |
87.4 (30.8) |
83.2 (28.4) |
98.7 (37.1) |
| Mean daily maximum °F (°C) | 67.7 (19.8) |
71.0 (21.7) |
75.6 (24.2) |
80.8 (27.1) |
85.3 (29.6) |
89.6 (32.0) |
90.6 (32.6) |
91.8 (33.2) |
88.5 (31.4) |
84.1 (28.9) |
76.4 (24.7) |
70.3 (21.3) |
81.0 (27.2) |
| Daily mean °F (°C) | 59.0 (15.0) |
62.8 (17.1) |
68.0 (20.0) |
73.6 (23.1) |
79.0 (26.1) |
83.1 (28.4) |
84.1 (28.9) |
84.7 (29.3) |
81.1 (27.3) |
76.0 (24.4) |
68.0 (20.0) |
61.2 (16.2) |
73.4 (23.0) |
| Mean daily minimum °F (°C) | 50.3 (10.2) |
54.5 (12.5) |
60.5 (15.8) |
66.5 (19.2) |
72.7 (22.6) |
76.6 (24.8) |
77.7 (25.4) |
77.5 (25.3) |
73.6 (23.1) |
68.0 (20.0) |
59.6 (15.3) |
52.2 (11.2) |
65.8 (18.8) |
| Mean minimum °F (°C) | 35.4 (1.9) |
37.9 (3.3) |
42.8 (6.0) |
52.6 (11.4) |
60.8 (16.0) |
71.0 (21.7) |
72.9 (22.7) |
72.9 (22.7) |
64.3 (17.9) |
50.8 (10.4) |
42.1 (5.6) |
35.5 (1.9) |
32.0 (0.0) |
| Record low °F (°C) | 15 (−9) |
20 (−7) |
29 (−2) |
38 (3) |
48 (9) |
58 (14) |
65 (18) |
64 (18) |
55 (13) |
32 (0) |
30 (−1) |
15 (−9) |
15 (−9) |
| Average precipitation inches (mm) | 1.13 (29) |
1.75 (44) |
1.33 (34) |
1.41 (36) |
2.39 (61) |
2.00 (51) |
2.39 (61) |
1.15 (29) |
5.37 (136) |
3.10 (79) |
1.98 (50) |
1.25 (32) |
25.25 (642) |
| Average snowfall inches (cm) | 0.0 (0.0) |
0.0 (0.0) |
0.0 (0.0) |
0.0 (0.0) |
0.0 (0.0) |
0.0 (0.0) |
0.0 (0.0) |
0.0 (0.0) |
0.0 (0.0) |
0.0 (0.0) |
0.0 (0.0) |
0.1 (0.25) |
0.1 (0.25) |
| Average precipitation days (≥ 0.01 in) | 6.3 | 5.1 | 4.4 | 3.6 | 4.2 | 4.1 | 3.6 | 2.8 | 8.7 | 5.5 | 4.8 | 5.7 | 58.8 |
| Average snowy days (≥ 0.1 in) | 0.0 | 0.0 | 0.0 | 0.0 | 0.0 | 0.0 | 0.0 | 0.0 | 0.0 | 0.0 | 0.0 | 0.0 | 0.0 |
| Source 1: NOAA | |||||||||||||
| Source 2: National Weather Service | |||||||||||||
Education
Port Mansfield is served by the San Perlita Independent School District. In addition, South Texas Independent School District operates magnet schools that serve the community.
See also
 In Spanish: Port Mansfield (Texas) para niños

