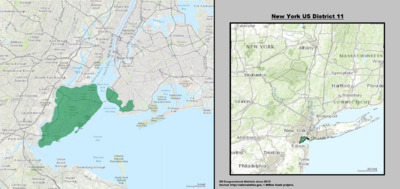
Quick facts for kids New York's 11th congressional district |

New York 's 11th congressional district since January 3, 2013
|
| Representative |
|
| Distribution |
|
| Population (2019) |
737,390 |
| Median income |
$81,253 |
| Ethnicity |
|
| Cook PVI |
R+3 |
New York's 11th congressional district is a congressional district for the United States House of Representatives in New York City. The 11th district includes all of Staten Island and areas of Brooklyn. The district is currently represented by Republican Nicole Malliotakis who was elected in 2020. The district used to be represented by Democrat Max Rose but was on of the few districts that changed to Republican in the 2020 elections.
Election history
| 1998 election |
| Party |
Candidate |
Votes |
% |
±% |
|
Democratic |
Major Owens |
75,773 |
90.0 |
-2.0 |
|
Republican |
David Greene |
7,284 |
8.7 |
+0.7 |
|
Independence |
Phyllis Taliaferro |
1,144 |
1.4 |
+1.4 |
| Majority |
68,489 |
81.3 |
-2.6 |
| Turnout |
84,201 |
|
-13.9 |
| 2000 election |
| Party |
Candidate |
Votes |
% |
±% |
|
Democratic |
Major Owens |
112,050 |
87.0 |
-3.0 |
|
Republican |
Susan Cleary |
8,406 |
6.5 |
-2.2 |
|
Liberal |
Una S.T. Clarke |
7,366 |
5.7 |
+5.7 |
|
Conservative |
Cartrell Gore |
962 |
0.7 |
+0.7 |
| Majority |
103,644 |
80.5 |
-0.8 |
| Turnout |
128,784 |
|
+52.9 |
| 2004 election |
| Party |
Candidate |
Votes |
% |
±% |
|
Democratic |
Major Owens |
144,999 |
94.0 |
+7.4 |
|
Independence |
Lorraine Stevens |
4,721 |
3.1 |
+3.1 |
|
Conservative |
Sol Lieberman |
4,478 |
2.9 |
+2.0 |
| Majority |
140,278 |
91.0 |
+17.0 |
| Turnout |
154,198 |
|
+73.5 |
| 2006 election |
| Party |
Candidate |
Votes |
% |
±% |
|
Democratic |
Yvette Clarke |
88,334 |
90.0 |
-4.0 |
|
Republican |
Stephen Finger |
7,447 |
7.6 |
+7.6 |
|
Conservative |
Marianna Blume |
1,325 |
1.4 |
-1.5 |
|
Freedom |
Ollie M. McClean |
996 |
1.0 |
+1.0 |
| Majority |
80,887 |
82.5 |
-8.5 |
| Turnout |
98,102 |
|
-36.4 |
| 2010 election |
| Party |
Candidate |
Votes |
% |
±% |
|
Democratic |
Yvette Clarke |
104,297 |
90.6 |
-2.2 |
|
Republican |
Hugh C. Carr |
10,858 |
9.4 |
+3.0 |
| Majority |
93,439 |
81.1 |
-5.3 |
| Turnout |
115,155 |
|
-36.6 |
| 2015 special election |
| Party |
Candidate |
Votes |
% |
±% |
|
Republican |
Daniel M. Donovan |
23,409 |
58.7 |
|
|
Democratic |
Vincent Gentile |
15,808 |
39.4 |
|
| Turnout |
42,569 |
|
|
| 2016 election |
| Party |
Candidate |
Votes |
% |
±% |
|
Republican |
Daniel M. Donovan |
134,366 |
62.2 |
|
|
Democratic |
Richard Reichard |
78,066 |
36.1 |
|
| Turnout |
216,023 |
|
|
See also
 In Spanish: 11.º distrito congresional de Nueva York para niños

 In Spanish: 11.º distrito congresional de Nueva York para niños
