Millsap, Texas facts for kids
Quick facts for kids
Millsap, Texas
|
|
|---|---|

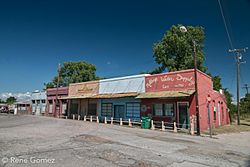
Millsap Park (demolished in 2019)
|
|

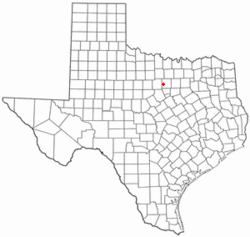
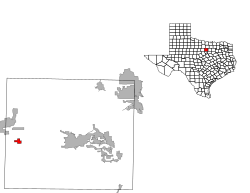
Location of Millsap, Texas
|
|
 |
|
| Country | United States |
| State | Texas |
| County | Parker |
| Area | |
| • Total | 1.47 sq mi (3.82 km2) |
| • Land | 1.47 sq mi (3.80 km2) |
| • Water | 0.01 sq mi (0.02 km2) |
| Elevation | 817 ft (249 m) |
| Population
(2020)
|
|
| • Total | 370 |
| • Density | 252/sq mi (96.9/km2) |
| Time zone | UTC-6 (Central (CST)) |
| • Summer (DST) | UTC-5 (CDT) |
| ZIP code |
76066
|
| Area code(s) | 940 |
| FIPS code | 48-48564 |
| GNIS feature ID | 1341692 |
Millsap is a town in Parker County, Texas, United States. Its population was 370 at the 2020 census.
Contents
History
Originally, Millsap was established as a relay station on the stagecoach route that ran from Weatherford to Palo Pinto. The town was named for Fuller Millsap, who moved to Texas in 1849 and to Parker County in 1856. A Millsap post office opened in 1877.
In 1880, the tracks of the Texas and Pacific Railway arrived. By the 1890s, Millsap was serving area farmers as a retail and shipping point. Within a decade the town had a bank, more than a dozen other businesses, three churches, a ten-grade educational institution called Millsap College, and a weekly newspaper, the Millsap News. The community population increased from an estimated 100 in 1890 to 800 in 1920.
Following World War II, however, Millsap declined, reaching a low of 261 by 1968. In 1988, 412 residents were reported, and in 1990 an estimated 485 residents lived there. By 2000, the population dropped to 353.
Geography
Millsap is located on Farm to Market Road 113, 15 miles west of Weatherford, in western Parker County. According to the United States Census Bureau, the town has a total area of 1.3 square miles (3.4 km2), of which 99.24% is land and 0.76% is covered by water.
The climate in this area is characterized by relatively high temperatures and evenly distributed precipitation throughout the year. The Köppen climate classification describes the weather as humid subtropical, Cfa.
| Climate data for Millsap, Texas | |||||||||||||
|---|---|---|---|---|---|---|---|---|---|---|---|---|---|
| Month | Jan | Feb | Mar | Apr | May | Jun | Jul | Aug | Sep | Oct | Nov | Dec | Year |
| Mean daily maximum °C (°F) | 14 (57) |
17 (62) |
21 (69) |
26 (78) |
29 (85) |
33 (92) |
36 (97) |
36 (96) |
32 (89) |
26 (79) |
20 (68) |
15 (59) |
26 (78) |
| Mean daily minimum °C (°F) | 0 (32) |
3 (37) |
7 (44) |
12 (53) |
17 (62) |
21 (69) |
22 (72) |
22 (72) |
18 (65) |
12 (54) |
6 (43) |
2 (35) |
12 (53) |
| Average precipitation mm (inches) | 43 (1.7) |
48 (1.9) |
64 (2.5) |
79 (3.1) |
100 (4.1) |
81 (3.2) |
61 (2.4) |
53 (2.1) |
74 (2.9) |
79 (3.1) |
48 (1.9) |
38 (1.5) |
770 (30.4) |
| Source: Weatherbase | |||||||||||||
Demographics
| Historical population | |||
|---|---|---|---|
| Census | Pop. | %± | |
| 1980 | 439 | — | |
| 1990 | 485 | 10.5% | |
| 2000 | 353 | −27.2% | |
| 2010 | 403 | 14.2% | |
| 2020 | 370 | −8.2% | |
| U.S. Decennial Census 2020 Census |
|||
As of the census of 2000, there were 353 people, 135 households, and 103 families residing in the town. The population density was 268.5 inhabitants per square mile (103.7/km2). There were 154 housing units at an average density of 117.1 per square mile (45.2/km2). The racial makeup of the town was 90.93% White, 0.28% Asian, 7.65% from other races, and 1.13% from two or more races. Hispanic or Latino of any race were 13.03% of the population.
There were 135 households, out of which 37.0% had children under the age of 18 living with them, 61.5% were married couples living together, 12.6% had a female householder with no husband present, and 23.7% were non-families. 20.7% of all households were made up of individuals, and 10.4% had someone living alone who was 65 years of age or older. The average household size was 2.61 and the average family size was 3.01.
In the town, the population was spread out, with 28.9% under the age of 18, 6.5% from 18 to 24, 26.3% from 25 to 44, 27.5% from 45 to 64, and 10.8% who were 65 years of age or older. The median age was 38 years. For every 100 females, there were 100.6 males. For every 100 females age 18 and over, there were 94.6 males.
The median income for a household in the town was $40,694, and the median income for a family was $43,229. Males had a median income of $30,714 versus $19,821 for females. The per capita income for the town was $15,699. About 4.4% of families and 6.6% of the population were below the poverty line, including 5.1% of those under age 18 and 13.8% of those age 65 or over.
Education
Millsap is served by the Millsap Independent School District.
See also
 In Spanish: Millsap (Texas) para niños

