Lynwood, Illinois facts for kids
Quick facts for kids
Lynwood, Illinois
|
||
|---|---|---|
|
||
| Motto(s):
"A progressive, growing community of families and friends"
|
||
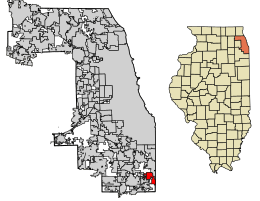
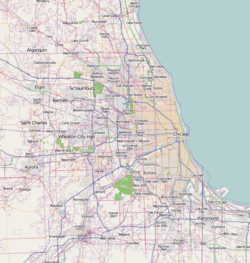
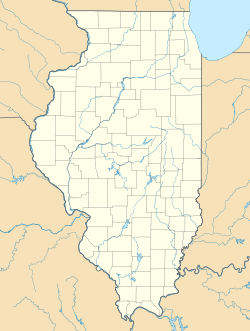
Location of Lynwood in Cook County, Illinois.
|
||
| Country | United States | |
| State | Illinois | |
| County | Cook | |
| Township | Bloom | |
| Founded | 1959 | |
| Government | ||
| • Type | Village | |
| Area | ||
| • Total | 5.04 sq mi (13.05 km2) | |
| • Land | 4.96 sq mi (12.86 km2) | |
| • Water | 0.08 sq mi (0.20 km2) | |
| Population
(2020)
|
||
| • Total | 9,116 | |
| • Density | 1,836.42/sq mi (709.11/km2) | |
| Time zone | UTC−6 (CST) | |
| • Summer (DST) | UTC−5 (CDT) | |
| ZIP Code |
60411
|
|
| Area code(s) | 708 | |
| FIPS code | 17-45421 | |
Lynwood is a village in Cook County, Illinois, United States, and a suburb of Chicago. The population was 9,116 at the 2020 census.
Lynwood was founded in 1959. The village is bordered by Lansing to the north, Glenwood to the west, Ford Heights and Sauk Village to the south, and Munster and Dyer, Indiana, to the east. The Indiana state line borders the entire eastern edge of Lynwood. Lynwood is currently a mix of suburban neighborhoods with a substantial amount of remaining farmland.
Geography
Lynwood is located at 41°31′35″N 87°32′53″W / 41.52639°N 87.54806°W (41.526351, −87.548194).
According to the 2021 census gazetteer files, Lynwood has a total area of 5.04 square miles (13.05 km2), of which 4.96 square miles (12.85 km2) (or 98.47%) is land and 0.08 square miles (0.21 km2) (or 1.53%) is water.
Surrounding areas
Demographics
| Historical population | |||
|---|---|---|---|
| Census | Pop. | %± | |
| 1960 | 255 | — | |
| 1970 | 1,042 | 308.6% | |
| 1980 | 4,195 | 302.6% | |
| 1990 | 6,535 | 55.8% | |
| 2000 | 7,377 | 12.9% | |
| 2010 | 9,007 | 22.1% | |
| 2020 | 9,116 | 1.2% | |
| U.S. Decennial Census 2010 2020 |
|||
As of the 2020 census there were 9,116 people, 3,052 households, and 2,253 families residing in the village. The population density was 1,808.37 inhabitants per square mile (698.22/km2). There were 3,624 housing units at an average density of 718.90 per square mile (277.57/km2). The racial makeup of the village was 75.95% African American, 13.95% White, 0.43% Native American, 0.47% Asian, 0.01% Pacific Islander, 3.70% from other races, and 5.48% from two or more races. Hispanic or Latino of any race were 8.25% of the population.
There were 3,052 households, out of which 35.6% had children under the age of 18 living with them, 40.96% were married couples living together, 31.26% had a female householder with no husband present, and 26.18% were non-families. 22.35% of all households were made up of individuals, and 11.63% had someone living alone who was 65 years of age or older. The average household size was 3.63 and the average family size was 3.02.
The village's age distribution consisted of 23.5% under the age of 18, 13.3% from 18 to 24, 21.9% from 25 to 44, 30% from 45 to 64, and 11.3% who were 65 years of age or older. The median age was 38.4 years. For every 100 females, there were 83.5 males. For every 100 females age 18 and over, there were 78.7 males.
The median income for a household in the village was $76,154, and the median income for a family was $101,935. Males had a median income of $51,774 versus $36,304 for females. The per capita income for the village was $31,039. About 4.0% of families and 7.1% of the population were below the poverty line, including 8.8% of those under age 18 and 14.2% of those age 65 or over.
| Race / Ethnicity (NH = Non-Hispanic) | Pop 2000 | Pop 2010 | Pop 2020 | % 2000 | % 2010 | % 2020 |
|---|---|---|---|---|---|---|
| White alone (NH) | 3,516 | 2,265 | 1,187 | 47.66% | 25.15% | 13.02% |
| Black or African American alone (NH) | 3,337 | 5,886 | 6,869 | 45.24% | 65.35% | 75.35% |
| Native American or Alaska Native alone (NH) | 11 | 9 | 12 | 0.15% | 0.10% | 0.13% |
| Asian alone (NH) | 67 | 47 | 41 | 0.91% | 0.52% | 0.45% |
| Pacific Islander alone (NH) | 0 | 0 | 1 | 0.00% | 0.00% | 0.01% |
| Other race alone (NH) | 5 | 10 | 25 | 0.07% | 0.11% | 0.27% |
| Mixed race or Multiracial (NH) | 104 | 133 | 229 | 1.41% | 1.48% | 2.51% |
| Hispanic or Latino (any race) | 337 | 657 | 752 | 4.57% | 7.29% | 8.25% |
| Total | 7,377 | 9,007 | 9,116 | 100.00% | 100.00% | 100.00% |
Transportation
Pace provides bus service on Route 358 connecting Lynwood to destinations across the Southland.
See also
 In Spanish: Lynwood (Illinois) para niños


