Lauder, New Zealand facts for kids
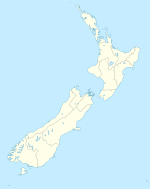
Lauder is a small settlement in the Otago Region of the South Island of New Zealand. It is located in Central Otago, 8 km northeast of Omakau, on the main route between Alexandra and Ranfurly, State Highway 85. The settlement was named after the town of the same name in southern Scotland, one of many Otago sites to be named after places in the Scottish borders by John Turnbull Thomson.
Lauder had a station on the former Otago Central Railway, now defunct, and served as a railway servicing town from the time the rails reached the town in 1904. It remains a popular stopover on the Otago Central Rail Trail. Lauder is the closest settlement to the Poolburn Gorge, a popular sight on the rail trail.
Atmospheric Research
Lauder's clear skies, low horizons, dry atmosphere, and southern latitude location make it an ideal site for atmospheric research.
The NIWA atmospheric research laboratory takes atmospheric measurements for the purpose of observing and better understanding interactions between the stratosphere, troposphere and global climate. This is achieved through measurements of ozone, ozone depleting substances (ODS), solar radiation, aerosols and greenhouse gases.
The clear night air around Lauder also makes the area popular with both amateur and professional astronomers.
Climate
| Climate data for Lauder, elevation 375 m (1,230 ft), (1991–2020) | |||||||||||||
|---|---|---|---|---|---|---|---|---|---|---|---|---|---|
| Month | Jan | Feb | Mar | Apr | May | Jun | Jul | Aug | Sep | Oct | Nov | Dec | Year |
| Record high °C (°F) | 35.8 (96.4) |
35.0 (95.0) |
31.5 (88.7) |
26.3 (79.3) |
24.0 (75.2) |
19.9 (67.8) |
18.4 (65.1) |
22.2 (72.0) |
24.9 (76.8) |
27.3 (81.1) |
30.7 (87.3) |
32.5 (90.5) |
35.8 (96.4) |
| Mean maximum °C (°F) | 30.7 (87.3) |
30.3 (86.5) |
27.5 (81.5) |
23.2 (73.8) |
19.3 (66.7) |
16.1 (61.0) |
15.2 (59.4) |
16.7 (62.1) |
20.3 (68.5) |
23.2 (73.8) |
26.0 (78.8) |
29.0 (84.2) |
32.2 (90.0) |
| Mean daily maximum °C (°F) | 23.3 (73.9) |
23.1 (73.6) |
20.4 (68.7) |
16.2 (61.2) |
12.3 (54.1) |
8.2 (46.8) |
7.7 (45.9) |
10.7 (51.3) |
13.9 (57.0) |
16.3 (61.3) |
18.7 (65.7) |
21.5 (70.7) |
16.0 (60.9) |
| Daily mean °C (°F) | 16.3 (61.3) |
15.9 (60.6) |
13.4 (56.1) |
9.8 (49.6) |
6.8 (44.2) |
3.3 (37.9) |
2.7 (36.9) |
5.2 (41.4) |
8.0 (46.4) |
10.1 (50.2) |
12.2 (54.0) |
14.8 (58.6) |
9.9 (49.8) |
| Mean daily minimum °C (°F) | 9.3 (48.7) |
8.7 (47.7) |
6.4 (43.5) |
3.4 (38.1) |
1.3 (34.3) |
−1.7 (28.9) |
−2.4 (27.7) |
−0.3 (31.5) |
2.1 (35.8) |
3.9 (39.0) |
5.7 (42.3) |
8.0 (46.4) |
3.7 (38.7) |
| Mean minimum °C (°F) | 1.6 (34.9) |
1.7 (35.1) |
−0.4 (31.3) |
−2.8 (27.0) |
−4.9 (23.2) |
−7.2 (19.0) |
−8.0 (17.6) |
−5.2 (22.6) |
−3.9 (25.0) |
−2.5 (27.5) |
−1.5 (29.3) |
1.1 (34.0) |
−8.5 (16.7) |
| Record low °C (°F) | −1.6 (29.1) |
−1.9 (28.6) |
−3.0 (26.6) |
−5.1 (22.8) |
−7.8 (18.0) |
−15.4 (4.3) |
−19.7 (−3.5) |
−8.5 (16.7) |
−6.7 (19.9) |
−4.6 (23.7) |
−4.3 (24.3) |
−1.7 (28.9) |
−19.7 (−3.5) |
| Average rainfall mm (inches) | 52.7 (2.07) |
43.5 (1.71) |
35.9 (1.41) |
38.1 (1.50) |
34.1 (1.34) |
34.3 (1.35) |
21.5 (0.85) |
18.9 (0.74) |
23.8 (0.94) |
35.6 (1.40) |
41.8 (1.65) |
50.9 (2.00) |
431.1 (16.96) |
| Source: NIWA | |||||||||||||


