Lake Coleridge facts for kids
Quick facts for kids Lake Coleridge |
|
|---|---|

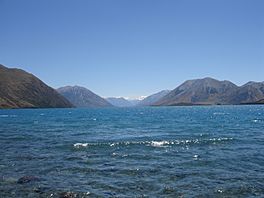
Lake Coleridge looking north-west from the southern end.
|
|
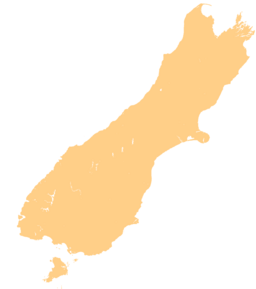
| Location | Selwyn District, Canterbury region, South Island |
| Coordinates | 43°17′S 171°30′E / 43.283°S 171.500°E |
| Native name | Whakamatau (Māori) |
| Primary inflows | Harper, Wilberforce, Acheron |
| Primary outflows | Rakaia River (via Coleridge Power Station) |
| Basin countries | New Zealand |
| Max. length | 11 km (6.8 mi) |
| Max. width | 4.8 km (3.0 mi) |
| Surface area | 47 km2 (18 sq mi) |
| Max. depth | 200 m (660 ft) |
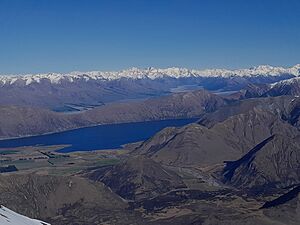
Lake Coleridge (Māori: Whakamatau) is located in inland Canterbury, in New Zealand's South Island. Located 35 kilometres (22 mi) to the northwest of Methven, it has a surface area of 47 square kilometres (18 sq mi). The lake is situated in an over-deepened valley formed by a glacier over 20,000 years ago in the Pleistocene era. It currently has no natural outflows. There is a small settlement at the lake.
Ecology
Early colonial explorers found the shores of the lake covered in mānuka (or kānuka), kōwhai, cabbage trees, flax and general swamp plants. The lake was also surrounded by Southern Rata trees, and native beech trees. The lake itself was fairly lacking in aquatic plants due to a lack of nutrients. The lake was known for a population of large eels.
Human activity has significantly changed the ecology. Colonial settlers introduced game fish including rainbow trout, brown trout, Atlantic salmon and Chinook salmon. The changing water levels caused by the operation of the Coleridge Power Station killed most of the kānuka in 1914 and rata in 1923. In modern times a mixture of native and introduced plants surround the lake, including matagouri, broom, gorse, briar, coprosma and biddi-biddi.
History

Pre-history
The area of the lake was formed by glacial erosion, probably during the Waimaungan, Waimean and Otiran glaciations. The lake sits close to multiple geological fault-lines, including the Porters Pass Fault, the Cass Fault and the Blue Hill Fault.
Māori
There is evidence of Māori activity in the area dating back potentially as far as the 13th century, with some nearby archaeological camp fires and moa bones carbon-dated to between 1340 and 1420 AD. While the area would have initially been thickly forested, large fires destroyed most of the vegetation between 1200 and 1400. Later the lake became an important stopping place for coastal tribes making the difficult journey between east and West Coast to obtain pounamu, due to the abundant eels, weka and water fowl that could be used to replenish stocks on the long journey.
Colonisation and modern times
The Lake was named by the chief surveyor of the Canterbury Association, Joseph Thomas, on a sketch map prepared in early 1849. It commemorates two early members of the Canterbury Association, Edward Coleridge and William Coleridge, who were first cousins and both nephews of Samuel Taylor Coleridge. Two further members of the Coleridge family joined the Canterbury Association in June 1851, i.e. after the lake had been named: John Taylor Coleridge (a brother of Edward), and John Coleridge, one of John Taylor's sons.
The lake is the site of one of the country's earliest hydroelectric schemes, the Coleridge Power Station, initially completed in 1914 and built mainly to supply power to Christchurch. The project makes use of the difference in altitude between the lake and river (the lake is 150 metres or 490 feet higher). Both the Harper and Wilberforce rivers have had some of their flow diverted into the lake, with up to 100% of the Harper's flow diverted for the power station. The power station is still operating today.

The lake was the epicentre for the 6.5 magnitude earthquake that struck on 26 June 1946.
Climate
| Climate data for Lake Coleridge, elevation 364 m (1,194 ft), (1981–2010) | |||||||||||||
|---|---|---|---|---|---|---|---|---|---|---|---|---|---|
| Month | Jan | Feb | Mar | Apr | May | Jun | Jul | Aug | Sep | Oct | Nov | Dec | Year |
| Mean daily maximum °C (°F) | 22.4 (72.3) |
22.0 (71.6) |
20.2 (68.4) |
17.3 (63.1) |
13.9 (57.0) |
10.6 (51.1) |
10.0 (50.0) |
11.8 (53.2) |
14.5 (58.1) |
16.2 (61.2) |
18.4 (65.1) |
20.4 (68.7) |
16.5 (61.7) |
| Daily mean °C (°F) | 16.2 (61.2) |
15.9 (60.6) |
14.2 (57.6) |
11.3 (52.3) |
8.2 (46.8) |
5.5 (41.9) |
4.7 (40.5) |
6.3 (43.3) |
8.7 (47.7) |
10.6 (51.1) |
12.6 (54.7) |
14.5 (58.1) |
10.7 (51.3) |
| Mean daily minimum °C (°F) | 10.0 (50.0) |
9.7 (49.5) |
8.1 (46.6) |
5.3 (41.5) |
2.5 (36.5) |
0.3 (32.5) |
−0.6 (30.9) |
0.7 (33.3) |
2.9 (37.2) |
5.0 (41.0) |
6.7 (44.1) |
8.6 (47.5) |
4.9 (40.9) |
| Average rainfall mm (inches) | 57.1 (2.25) |
37.4 (1.47) |
60.1 (2.37) |
67.1 (2.64) |
55.7 (2.19) |
74.7 (2.94) |
80.2 (3.16) |
97.8 (3.85) |
90.5 (3.56) |
80.4 (3.17) |
66.5 (2.62) |
56.4 (2.22) |
823.9 (32.44) |
| Source: NIWA (rain 1991–2020) | |||||||||||||
| Climate data for Harper River, elevation 533 m (1,749 ft), (1991–2020) | |||||||||||||
|---|---|---|---|---|---|---|---|---|---|---|---|---|---|
| Month | Jan | Feb | Mar | Apr | May | Jun | Jul | Aug | Sep | Oct | Nov | Dec | Year |
| Mean daily maximum °C (°F) | 21.2 (70.2) |
21.7 (71.1) |
19.0 (66.2) |
16.0 (60.8) |
13.2 (55.8) |
9.9 (49.8) |
9.3 (48.7) |
10.8 (51.4) |
12.9 (55.2) |
14.9 (58.8) |
16.6 (61.9) |
19.3 (66.7) |
15.4 (59.7) |
| Daily mean °C (°F) | 15.4 (59.7) |
15.5 (59.9) |
13.2 (55.8) |
10.5 (50.9) |
8.2 (46.8) |
5.2 (41.4) |
4.4 (39.9) |
5.8 (42.4) |
7.8 (46.0) |
9.6 (49.3) |
11.3 (52.3) |
13.7 (56.7) |
10.0 (50.1) |
| Mean daily minimum °C (°F) | 9.6 (49.3) |
9.3 (48.7) |
7.5 (45.5) |
5.1 (41.2) |
3.2 (37.8) |
0.6 (33.1) |
−0.6 (30.9) |
0.8 (33.4) |
2.7 (36.9) |
4.3 (39.7) |
6.0 (42.8) |
8.1 (46.6) |
4.7 (40.5) |
| Average rainfall mm (inches) | 89.1 (3.51) |
54.7 (2.15) |
90.4 (3.56) |
77.2 (3.04) |
91.5 (3.60) |
136.9 (5.39) |
86.0 (3.39) |
130.5 (5.14) |
119.7 (4.71) |
126.3 (4.97) |
125.6 (4.94) |
92.9 (3.66) |
1,220.8 (48.06) |
| Source: NIWA | |||||||||||||


