Image: Whiteopaqueregulation

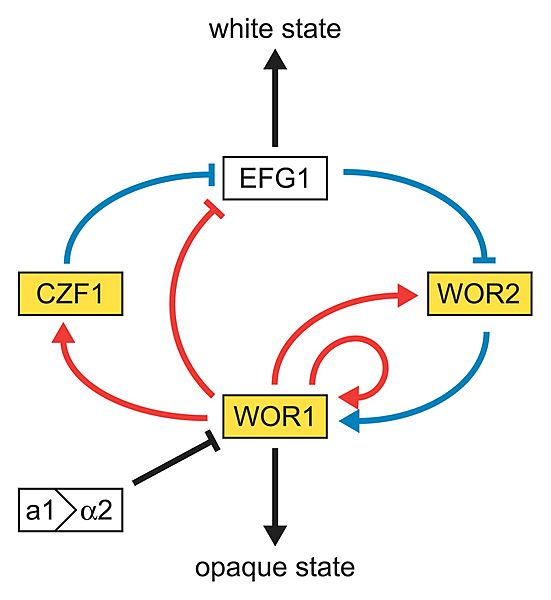
Description: Model of the Genetic Network Regulating the White-Opaque Switch in Candida albicans White and gold boxes represent genes enriched in the white and opaque states, respectively. Blue lines represent relationships based on genetic epistasis. Red lines represent Wor1 control of each gene, based on Wor1 enrichment in chromatin immunoprecipitation experiments. Activation (arrowhead) and repression (bar) are inferred based on white- and opaque-state expression of each gene.
Title: Whiteopaqueregulation
Credit: Interlocking Transcriptional Feedback Loops Control White-Opaque Switching in Candida albicans Zordan RE, Miller MG, Galgoczy DJ, Tuch BB, Johnson AD PLoS Biology Vol. 5, No. 10, e256 doi:10.1371/journal.pbio.0050256 http://biology.plosjournals.org/perlserv/?request=slideshow&type=figure&doi=10.1371/journal.pbio.0050256&id=85635
Author: Article written by Rebecca E. Zordan, Mathew G. Miller, David J. Galgoczy, Brian B. Tuch, Alexander D. Johnson
Usage Terms: Creative Commons Attribution 2.5
License: CC BY 2.5
License Link: https://creativecommons.org/licenses/by/2.5
Attribution Required?: Yes
Image usage
The following page links to this image:

