
Image: WMAP 2010
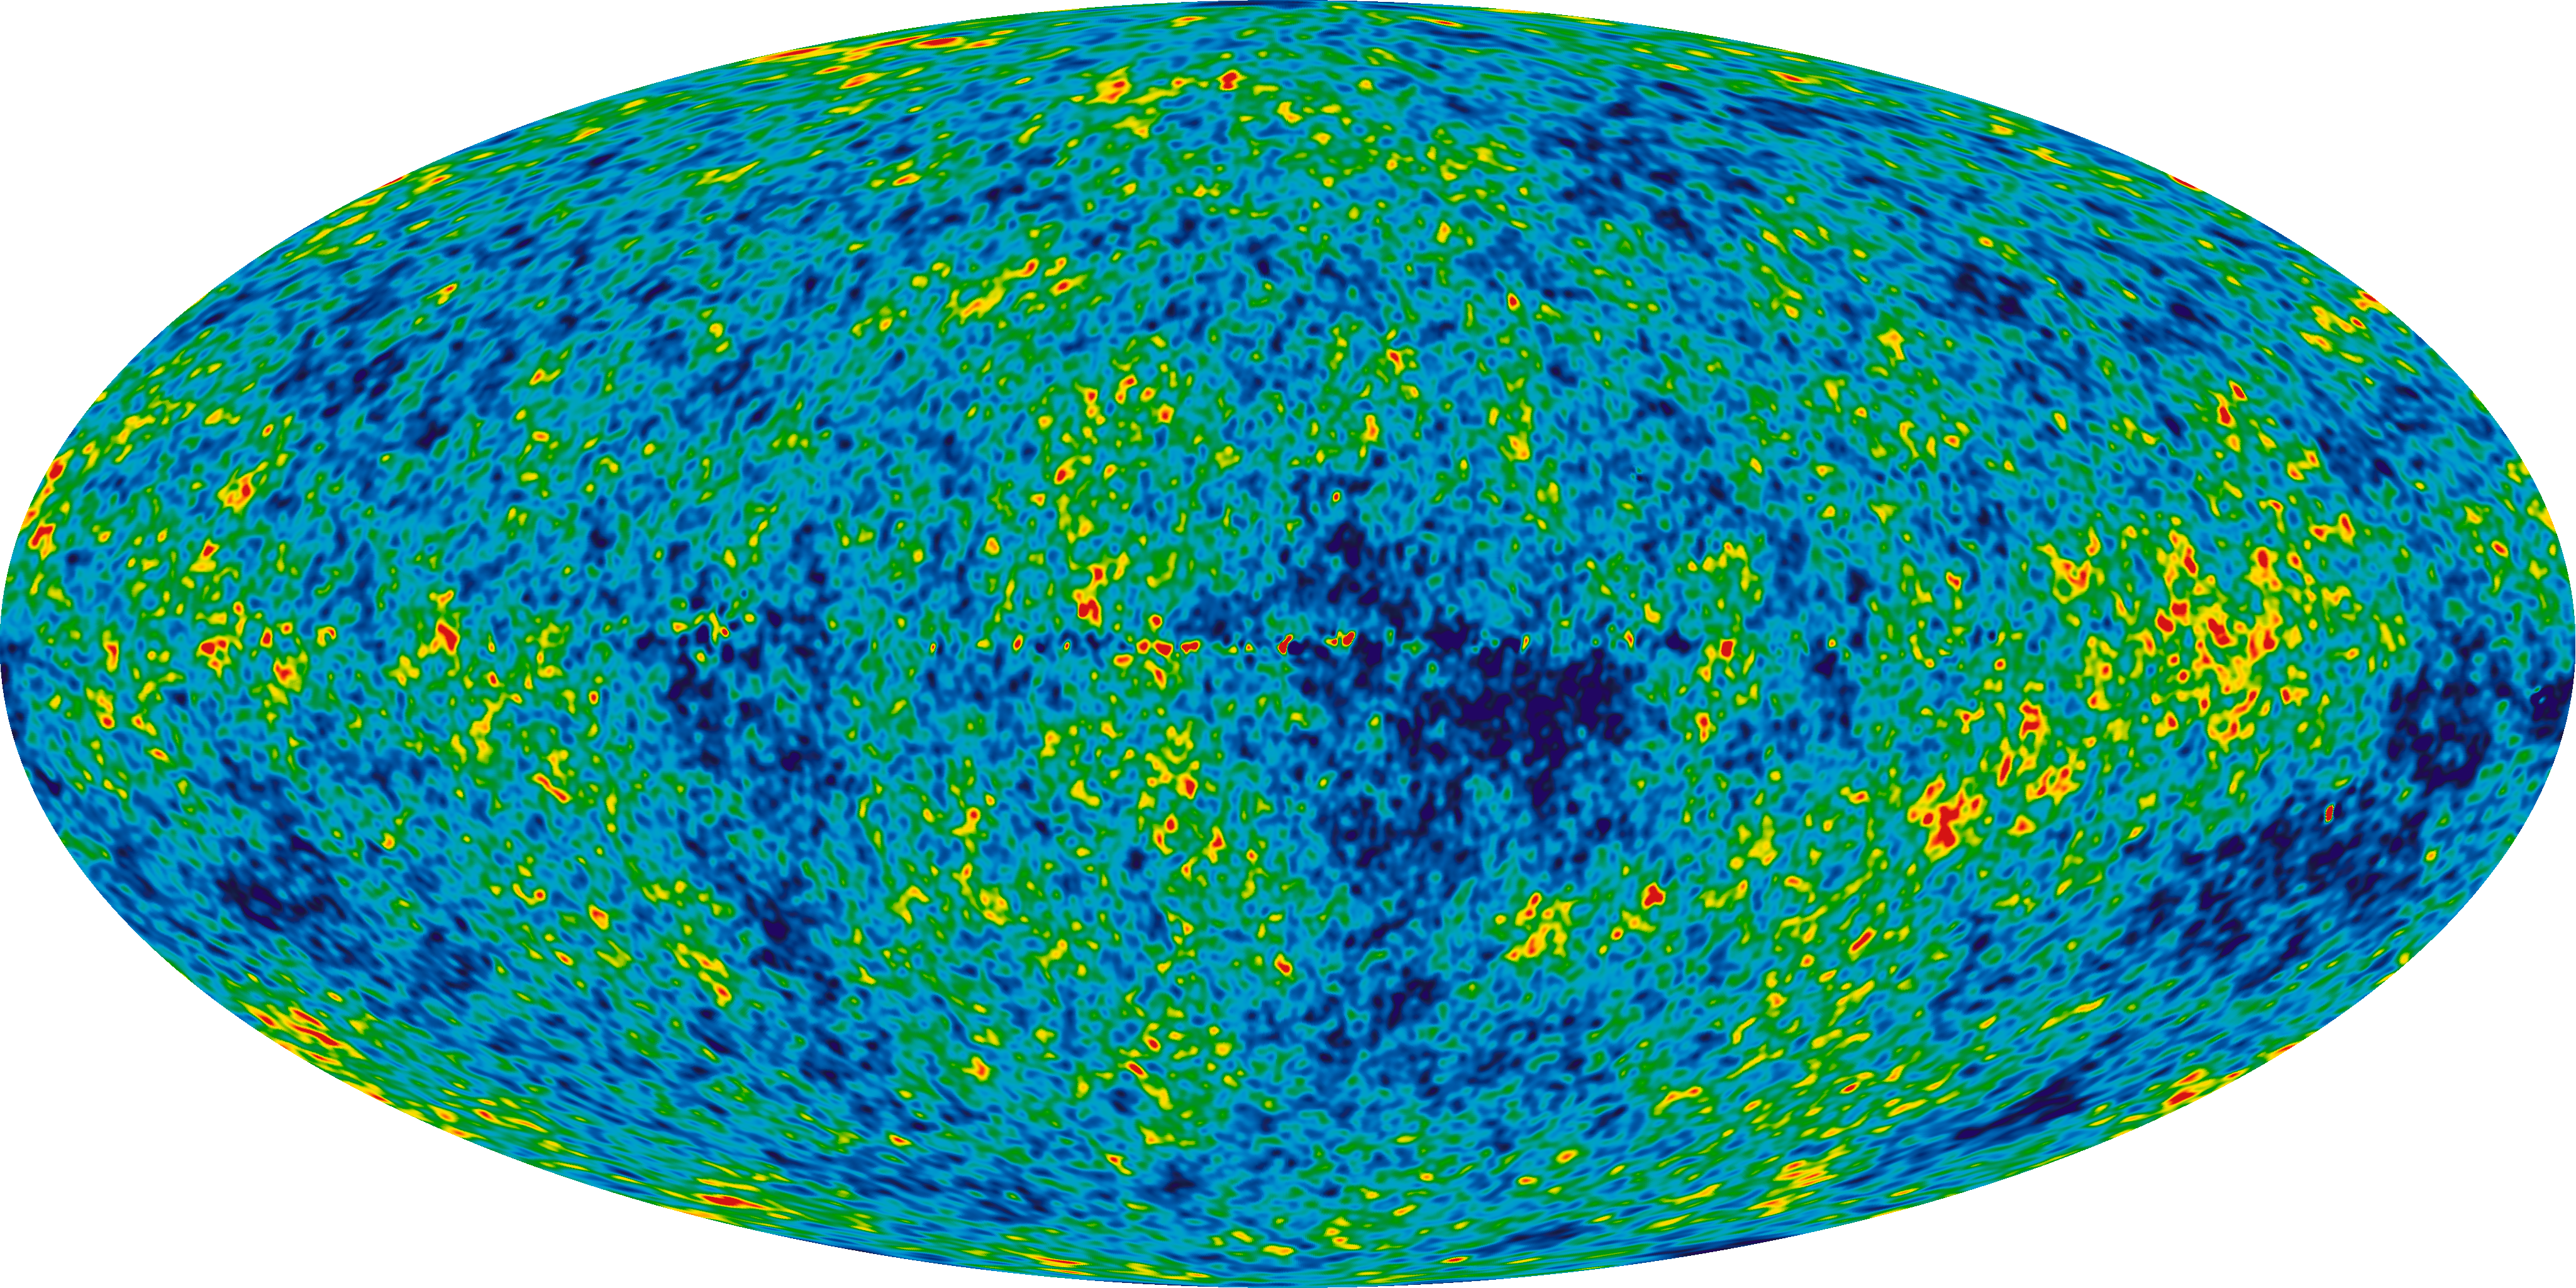
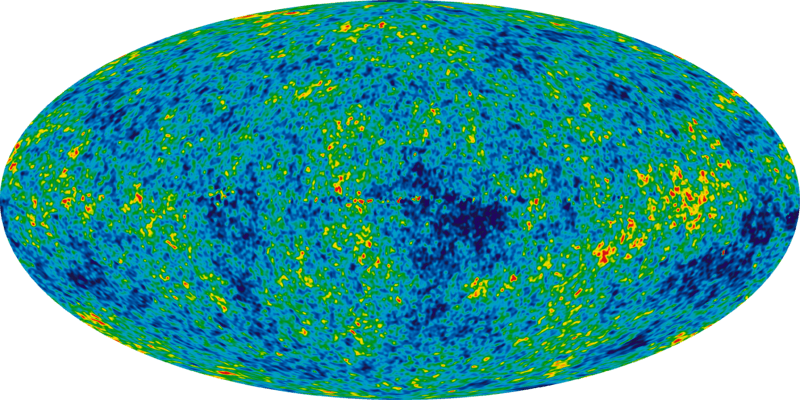
Description: The Cosmic Microwave Background temperature fluctuations from the 7-year Wilkinson Microwave Anisotropy Probe data seen over the full sky. The image is a mollweide projection of the temperature variations over the celestial sphere.The average temperature is 2.725 Kelvin degrees above absolute zero (absolute zero is equivalent to -273.15 ºC or -459 ºF), and the colors represent the tiny temperature fluctuations, as in a weather map. Red regions are warmer and blue regions are colder by about 0.0002 degrees. This map is the ILC (Internal Linear Combination) map, which attempts to subtract out noise from the galaxy and other sources. The technique is of uncertain reliability, especially on smaller scales [1], so other maps are typically used for detailed scientific analysis
Title: WMAP 2010
Credit: http://wmap.gsfc.nasa.gov/media/101080
Author: NASA
Usage Terms: Public domain
License: Public domain
Attribution Required?: No
Image usage
The following 30 pages link to this image:
- Age of the universe
- Alexander Friedmann
- Arno Allan Penzias
- Big Rip
- Brian Schmidt
- Comoving and proper distances
- Cosmic microwave background
- Cosmic microwave background radiation
- Edwin Hubble
- False vacuum decay
- Fine-tuned universe
- Galaxy filament
- George F. R. Ellis
- George Gamow
- George Smoot
- Georges Lemaître
- History of the Big Bang theory
- Inflation (cosmology)
- John C. Mather
- Nicolaus Copernicus
- Rashid Sunyaev
- Richard C. Tolman
- Robert H. Dicke
- Roger Penrose
- Steady-state model
- Stephen Hawking
- Wilkinson Microwave Anisotropy Probe
- Willem de Sitter
- Yakov Zeldovich
- Template:Physical cosmology
