
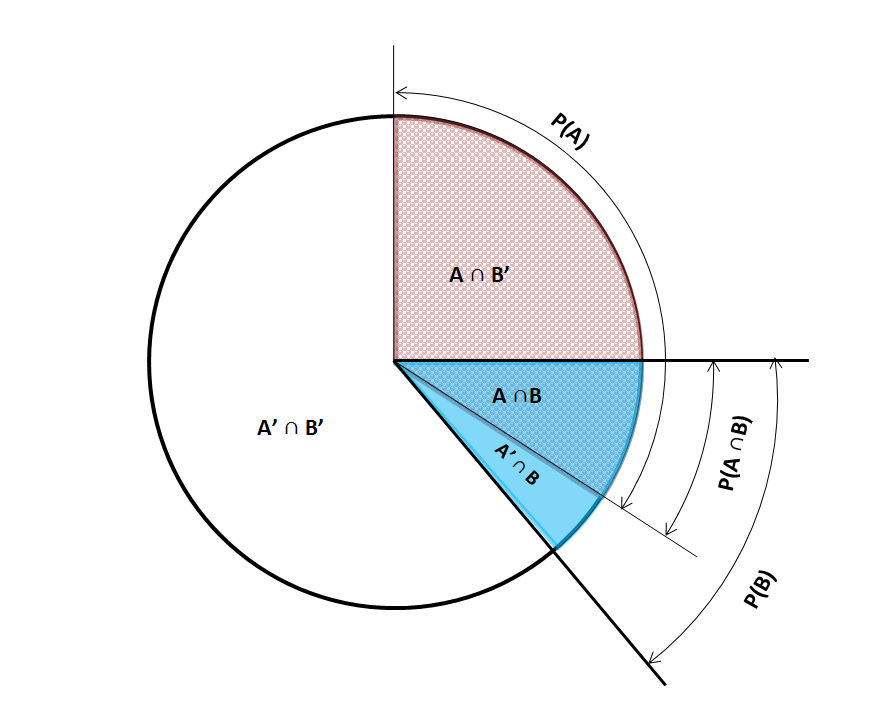
Image: Venn Pie Chart describing Bayes' law
Size of this preview: 731 × 599 pixels. Other resolutions: 293 × 240 pixels | 883 × 724 pixels.
Original image (883 × 724 pixels, file size: 61 KB, MIME type: image/png)
Description: Venn Pie Chart is an area proportional pie chart which serves as an alternative to traditional Venn diagrams describing relations between event in Bayes' theorem. It shows not only relations but ratios between probabilities of events.
Title: Venn Pie Chart describing Bayes' law
Credit: Own work
Author: Andrew Batishchev
Usage Terms: Creative Commons Attribution-Share Alike 3.0
License: CC BY-SA 3.0
License Link: https://creativecommons.org/licenses/by-sa/3.0
Attribution Required?: Yes
Image usage
The following page links to this image:

All content from Kiddle encyclopedia articles (including the article images and facts) can be freely used under Attribution-ShareAlike license, unless stated otherwise.