
Image: UnemploymentNewcastleNSW

Size of this preview: 800 × 517 pixels. Other resolutions: 320 × 207 pixels | 999 × 645 pixels.
Original image (999 × 645 pixels, file size: 21 KB, MIME type: image/png)
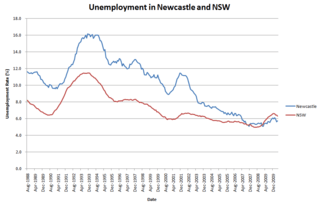
Description: This graph shows a 12 month rolling average of the unemployment rate in the Newcastle LGA and NSW between Aug 1988 and May 2010. Data was sourced on 20 June 2010 from: http://www.abs.gov.au/AUSSTATS/abs@.nsf/DetailsPage/6291.0.55.001May%202010?OpenDocument http://www.abs.gov.au/AUSSTATS/abs@.nsf/DetailsPage/6291.0.55.001Oct%202007?OpenDocument
Title: UnemploymentNewcastleNSW
Credit: Own work
Author: Rational1991
Usage Terms: Public domain
License: Public domain
Attribution Required?: No
Image usage
There are no pages that link to this image.

All content from Kiddle encyclopedia articles (including the article images and facts) can be freely used under Attribution-ShareAlike license, unless stated otherwise.