
Image: US Private Debt to GDP by Sector

Size of this preview: 800 × 600 pixels. Other resolutions: 320 × 240 pixels | 960 × 720 pixels.
Original image (960 × 720 pixels, file size: 15 KB, MIME type: image/png)
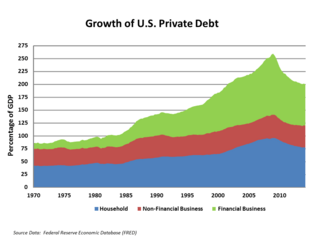
Description: US Private Debt to GDP ratio for Households, Non-Financial Business, and Financial Business. Each is layered, so the highest point represents the sum of all three data series. Other information Based on similar chart in Martin Wolf's book "The Shifts and the Shocks" as described in NYT article "Why Weren't Alarm Bells Ringing".
Title: US Private Debt to GDP by Sector
Credit: Area chart created from FRED data using Excel
Author: Farcaster
Usage Terms: Creative Commons Attribution-Share Alike 3.0
License: CC BY-SA 3.0
License Link: http://creativecommons.org/licenses/by-sa/3.0
Attribution Required?: Yes
Image usage
The following 2 pages link to this image:

All content from Kiddle encyclopedia articles (including the article images and facts) can be freely used under Attribution-ShareAlike license, unless stated otherwise.