
Image: UK Vinyl Sales Graph In Units
No higher resolution available.
UK_Vinyl_Sales_Graph_In_Units.png (500 × 400 pixels, file size: 6 KB, MIME type: image/png)
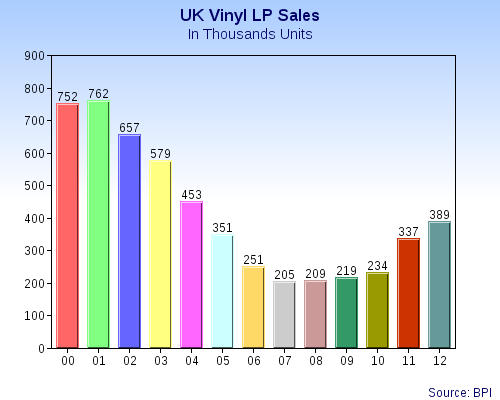
Description: A graph showing vinyl record LP sales in the United Kingdom from 2000 to 2012.
Title: UK Vinyl Sales Graph In Units
Credit: Computer graph Previously published: Not published elsewhere.
Author: Poiuytre
Usage Terms: Creative Commons Attribution-Share Alike 3.0
License: CC BY-SA 3.0
License Link: https://creativecommons.org/licenses/by-sa/3.0
Attribution Required?: Yes
Image usage
The following page links to this image:

All content from Kiddle encyclopedia articles (including the article images and facts) can be freely used under Attribution-ShareAlike license, unless stated otherwise.