
Image: U.S. Phillips Curve 2000 to 2013
Size of this preview: 800 × 600 pixels. Other resolutions: 320 × 240 pixels | 960 × 720 pixels.
Original image (960 × 720 pixels, file size: 89 KB, MIME type: image/png)
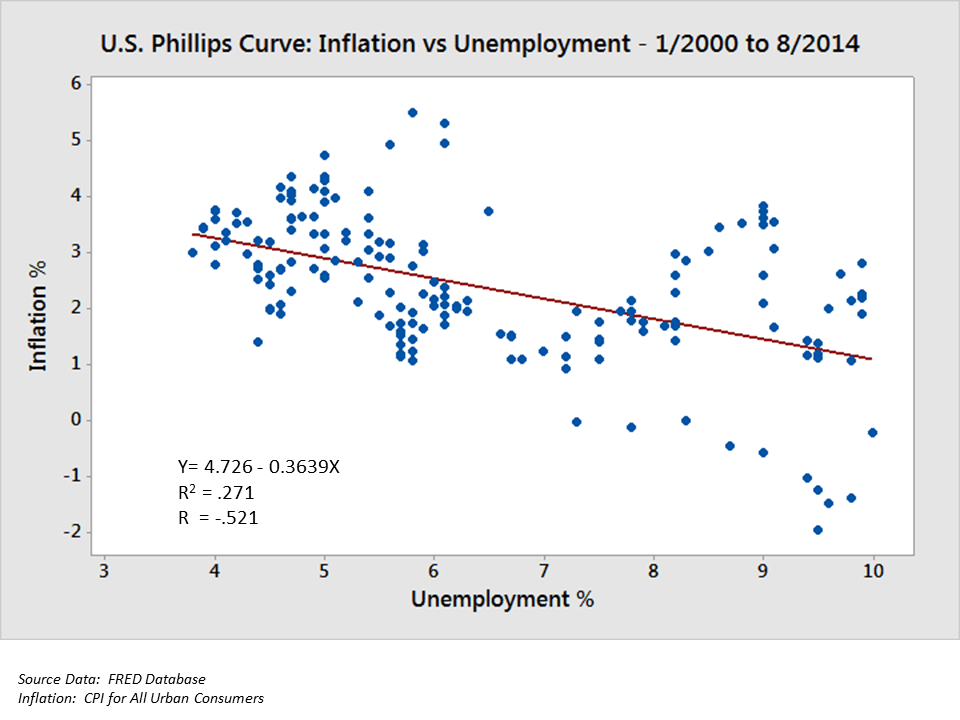
Description: Diagram shows the relationship between inflation and the unemployment rate, also called the Phillips Curve
Title: U.S. Phillips Curve 2000 to 2013
Credit: Inflation and Unemployment rate data by month from Federal Reserve Database
Author: Farcaster
Usage Terms: Creative Commons Attribution-Share Alike 3.0
License: CC BY-SA 3.0
License Link: http://creativecommons.org/licenses/by-sa/3.0
Attribution Required?: Yes
Image usage
The following page links to this image:

All content from Kiddle encyclopedia articles (including the article images and facts) can be freely used under Attribution-ShareAlike license, unless stated otherwise.