
Image: Sea level history and projections

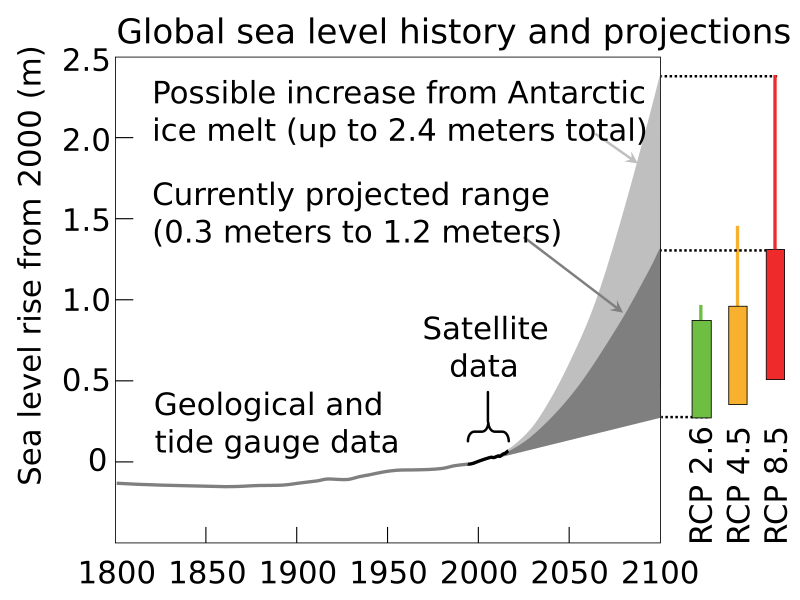
Description: Observed and projected changes in global mean sea level for 1800–2100. The boxes on the right show the very likely ranges in sea level rise by 2100 (relative to 2000) corresponding to three different RCP scenarios. The lines above the boxes show possible increases based on newer research of the potential contribution to sea level rise from Antarctic ice melt. Data from the U.S. Global Change Research Program for the Fourth National Climate Assessment. [https://nca2018.globalchange.gov/chapter/appendix-3#fig-A3-1 Direct link to specific source].
Author: Efbrazil
Usage Terms: Creative Commons Attribution-Share Alike 3.0
License: CC-BY-SA-3.0
License Link: http://creativecommons.org/licenses/by-sa/3.0/
Attribution Required?: Yes
Image usage
The following 2 pages link to this image:
