Image: Ramachandran plot general 100K

Size of this preview: 671 × 599 pixels. Other resolutions: 269 × 240 pixels | 750 × 670 pixels.
Original image (750 × 670 pixels, file size: 225 KB, MIME type: image/jpeg)
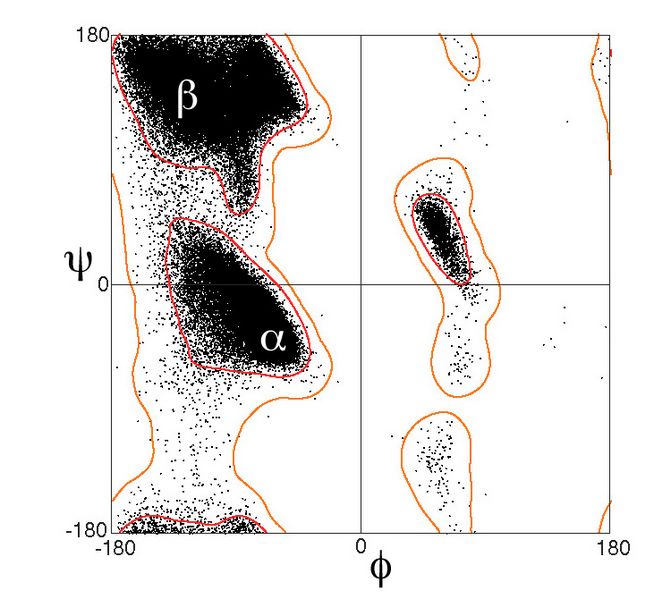
Description: φ,ψ plot ("Ramachandran diagram") of the torsion angles that specify protein backbone conformation, with the alpha-helix and beta-strand regions labeled. Data as in Lovell et al. 2003 Proteins 50:437, showing about 100,000 data points for general amino-acid types (not Gly, Pro, or pre-Pro) in high-resolution crystal structures.
Title: Ramachandran plot general 100K
Credit: Own work
Author: Dcrjsr
Usage Terms: Creative Commons Attribution 3.0
License: CC BY 3.0
License Link: http://creativecommons.org/licenses/by/3.0
Attribution Required?: Yes
Image usage
The following page links to this image:

All content from Kiddle encyclopedia articles (including the article images and facts) can be freely used under Attribution-ShareAlike license, unless stated otherwise.
