Image: Productivity Gap - v1

Size of this preview: 800 × 450 pixels. Other resolutions: 320 × 180 pixels | 1,280 × 720 pixels.
Original image (1,280 × 720 pixels, file size: 52 KB, MIME type: image/png)
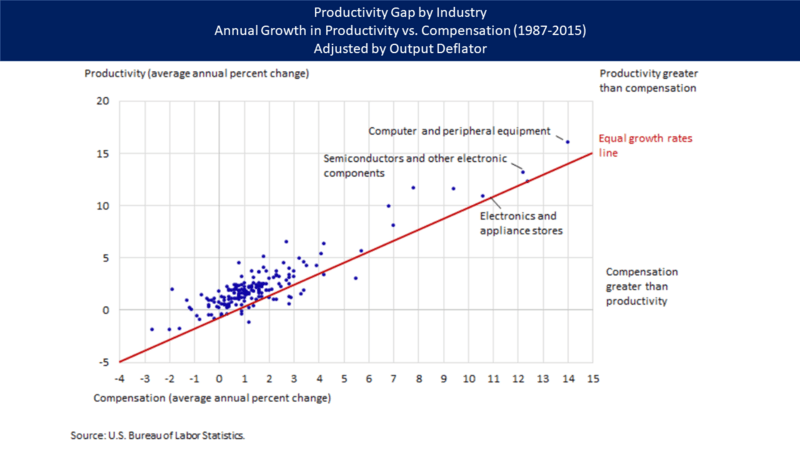
Description: Illustrates the productivity gap (i.e., the annual growth rate in productivity minus annual growth rate in compensation) by industry from 1985-2015. Each dot is an industry; dots above the line have a productivity gap (i.e., productivity growth has exceeded compensation growth), those below the line do not.
Title: Productivity Gap - v1
Credit: https://www.bls.gov/opub/btn/volume-6/understanding-the-labor-productivity-and-compensation-gap.htm
Author: U.S. Bureau of Labor Statistics
Usage Terms: Public domain
License: Public domain
Attribution Required?: No
Image usage
The following page links to this image:

All content from Kiddle encyclopedia articles (including the article images and facts) can be freely used under Attribution-ShareAlike license, unless stated otherwise.
