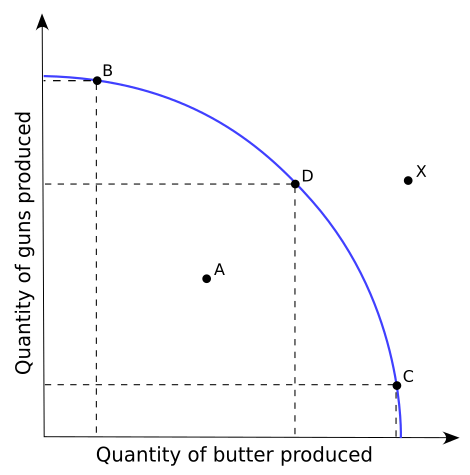
Image: Production Possibilities Frontier Curve

Description: A diagram showing the production possibilities frontier (PPF) curve for producing "Gun" and "butter". Point "A" lies below the curve, denoting underutilized production capacity. Points "B", "C", and "D" lie on the curve, denoting efficient utilization of production. Point "X" lies outside the curve, representing an impossible output for existing capital and/or technology. Shift of PPF to point "X", will change if their improvement of factors of production (ie Capital and/or technology)
Title: Production Possibilities Frontier Curve
Credit: Own work
Author: User:Everlong
Permission: GFDL und CC-BY-SA-2.5
Usage Terms: Creative Commons Attribution-Share Alike 3.0
License: CC-BY-SA-3.0
License Link: http://creativecommons.org/licenses/by-sa/3.0/
Attribution Required?: Yes
Image usage
The following page links to this image:

