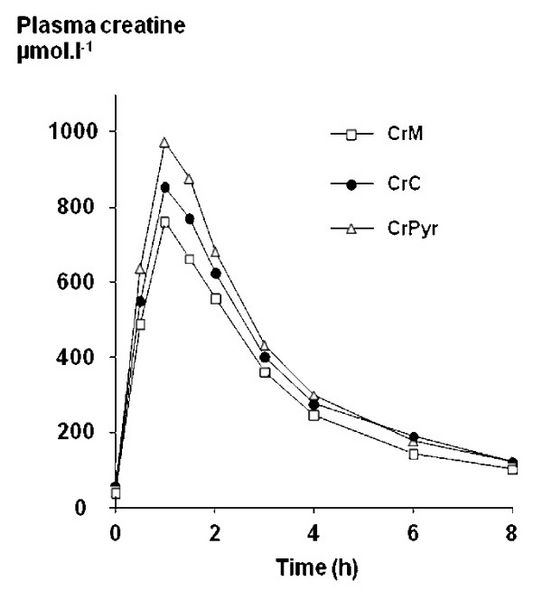
Image: Plasma creatine concentration over time

Size of this preview: 542 × 600 pixels. Other resolutions: 217 × 240 pixels | 600 × 664 pixels.
Original image (600 × 664 pixels, file size: 38 KB, MIME type: image/jpeg)
Description: This graph shows the mean plasma creatine concentration over an 8 hour period following ingestion of 4.4 grams of creatine in the form of creatine monohydrate (CrM), tri-creatine citrate (CrC), or creatine pyruvate (CrPyr).
Title: Plasma creatine concentration over time
Credit: (2007). "Comparison of new forms of creatine in raising plasma creatine levels". J Int Soc Sports Nutr 4: 17. DOI:10.1186/1550-2783-4-17. PMID 17997838. PMC: 2206055.
Author: Jäger R, Harris RC, Purpura M, Francaux M
Usage Terms: Creative Commons Attribution 2.0
License: CC BY 2.0
License Link: https://creativecommons.org/licenses/by/2.0
Attribution Required?: Yes
Image usage
The following page links to this image:

All content from Kiddle encyclopedia articles (including the article images and facts) can be freely used under Attribution-ShareAlike license, unless stated otherwise.
