Image: PlanckianLocus

Size of this preview: 533 × 599 pixels. Other resolutions: 213 × 240 pixels | 1,300 × 1,462 pixels.
Original image (1,300 × 1,462 pixels, file size: 461 KB, MIME type: image/png)
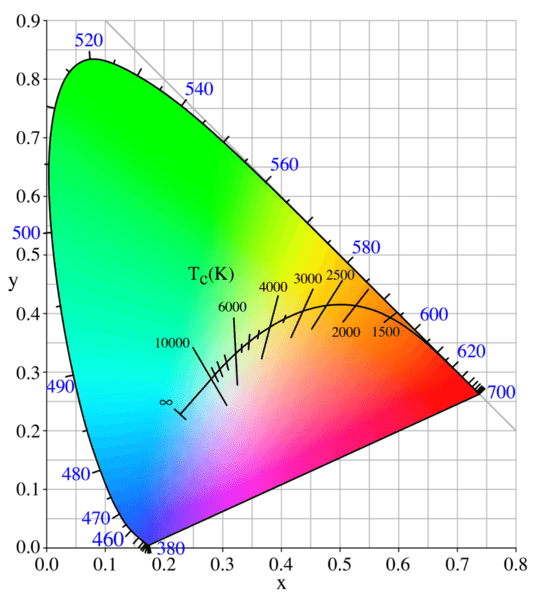
Description: CIE xy 1931 chromaticity diagram including the Planckian Locus. The Planckian locus is the path that a black body color will take through the diagram as the black body temperature changes. Lines crossing the locus indicate lines of constant correlated color temperature. Monochromatic wavelengths are shown in blue in units of nanometers. Latest version (16 April 2005) uses 1931 CIE standard observer, since this is the most commonly used standard observer.
Title: PlanckianLocus
Credit: en:User:PAR
Author: en:User:PAR
Usage Terms: Public domain
License: Public domain
Attribution Required?: No
Image usage
The following page links to this image:

All content from Kiddle encyclopedia articles (including the article images and facts) can be freely used under Attribution-ShareAlike license, unless stated otherwise.
