
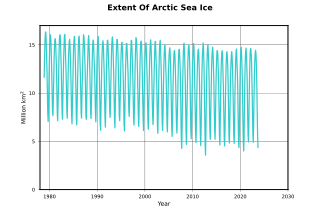
Image: NSIDC arctic sea ice extent since 1979

Size of this PNG preview of this SVG file: 800 × 533 pixels. Other resolution: 320 × 213 pixels.
Original image (SVG file, nominally 810 × 540 pixels, file size: 37 KB)
Description: Plot of arctic sea ice extent development between 1979 and 2023 in monthly mean values. For the determination of the "area" value, every pixel with a sea ice concentration > .15 is taken. The pixel area is multiplied with the concentration value derived from the passive infrared signal. For the "extent" value, the concentration value is taken as 1, so we basically get full area with >.15 concentration.
Usage Terms: Public domain
Image usage
The following page links to this image:

All content from Kiddle encyclopedia articles (including the article images and facts) can be freely used under Attribution-ShareAlike license, unless stated otherwise.