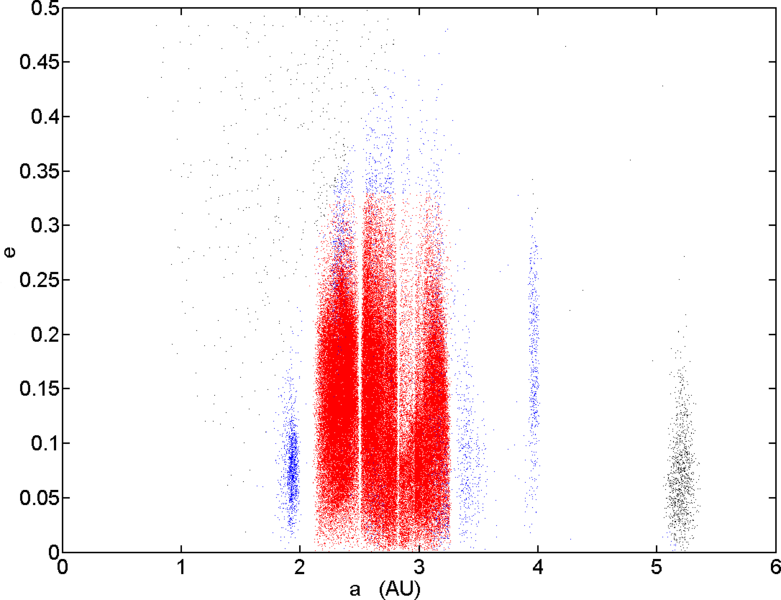
Image: Main belt e vs a

Description: Plot of eccentricity e vs en:semi-major axis a for numbered en:asteroids inward of about 6 AU. The en:main belt is shown in red and blue, and contains 98.5% of all the objects. Within this, the "core" region between the 4:1 and 2:1 en:Kirkwood gaps, and at moderate inclinations and eccentricities is shown in red. It contains 93.4% of all the objects. For reference, en:Mars orbits out to 1.666 AU, and en:Jupiter between 4.95 and 5.46 AU. The diagram was created by me (Piotr Deuar) using orbit data for 120437 numbered minor planets from the Minor Planet Center orbit databse, dated 8 Feb 2006.
Title: Main belt e vs a
Credit: Originally from en.wikipedia; description page is/was here.
Author: Deuar at English Wikipedia
Usage Terms: GNU Free Documentation License
License: GFDL
License Link: http://www.gnu.org/copyleft/fdl.html
Attribution Required?: Yes
Image usage
The following page links to this image:

