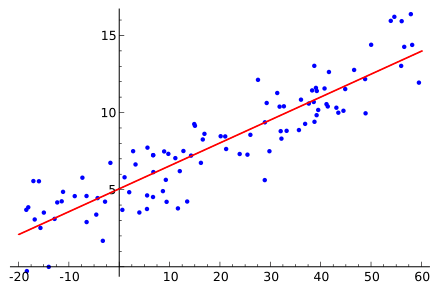
Image: Linear regression

Size of this PNG preview of this SVG file: 438 × 289 pixels. Other resolution: 320 × 211 pixels.
Original image (SVG file, nominally 438 × 289 pixels, file size: 71 KB)
Description: Random data points and their linear regression. Created with the following Sage (http://sagemath.org) commands: X = RealDistribution('uniform', [-20, 80 ]) Y = RealDistribution('gaussian', 1.5) f(x) = 3*x/20 + 5 xvals = [X.get_random_element() for _ in range(100)] data = [(x, f(x) + Y.get_random_element()) for x in xvals] m, b = var('m b') g(x) = m*x + b g(x) = g(x).subs(find_fit(data, g, solution_dict=True)) p = list_plot(data) + plot(g, (x, -20, 60), color='red') p.save('linear_regression.svg')
Title: Linear regression
Credit: Own work
Author: Sewaqu
Usage Terms: Public domain
License: Public domain
Attribution Required?: No
Image usage
The following 2 pages link to this image:

All content from Kiddle encyclopedia articles (including the article images and facts) can be freely used under Attribution-ShareAlike license, unless stated otherwise.
