Image: Hill Plot MWC model
Hill_Plot_MWC_model.png (605 × 549 pixels, file size: 51 KB, MIME type: image/png)
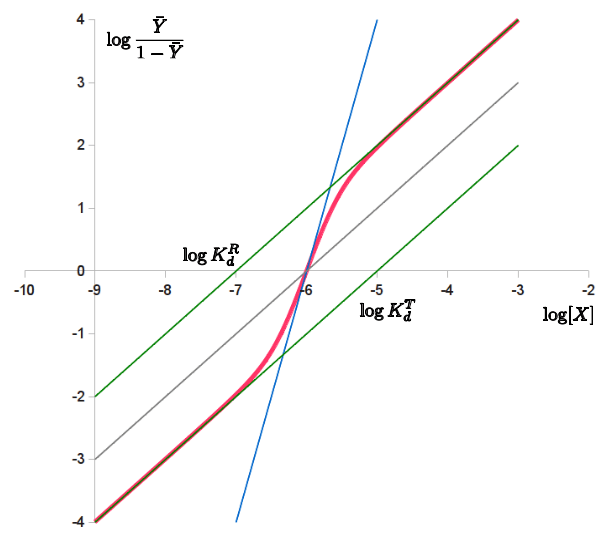
Description: Hill plot of the Monod-Wyman-Changeux model, showing the changing slope of the binding function in red, indicating a Hill coefficient depending on saturation, and the intercepts of the green asymptots providing the dissociation constants of the R and T states. In blue is shown the corresponding Hill function and in grey the corresponding non-cooperative binding.
Title: Hill Plot MWC model
Credit: Own work
Author: Lenov
Usage Terms: Creative Commons Attribution 3.0
License: CC BY 3.0
License Link: http://creativecommons.org/licenses/by/3.0
Attribution Required?: Yes
Image usage
The following page links to this image:

All content from Kiddle encyclopedia articles (including the article images and facts) can be freely used under Attribution-ShareAlike license, unless stated otherwise.

