Image: Haynesville region natural gas production (January 2010-July 2018) (44530715841)
Haynesville_region_natural_gas_production_(January_2010-July_2018)_(44530715841).png (566 × 288 pixels, file size: 24 KB, MIME type: image/png)
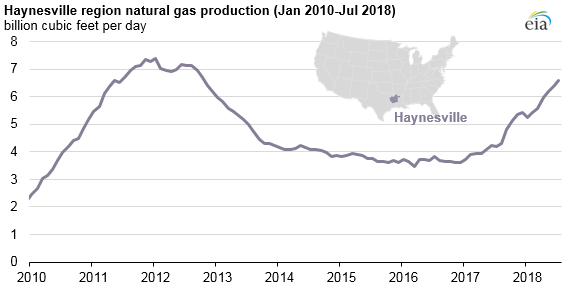
Description: In June 2018, natural gas production in the Haynesville shale formation, located in northeastern Texas and Louisiana, averaged 6.4 billion cubic feet per day (Bcf/d), accounting for 8.5% of total U.S. dry natural gas production and the highest production from this region since September 2012. <a href="https://go.usa.gov/xPaaB" rel="nofollow">go.usa.gov/xPaaB</a> September 7, 2018
Title: Haynesville region natural gas production (January 2010-July 2018) (44530715841)
Credit: Haynesville region natural gas production (January 2010-July 2018)
Author: U.S. Energy Information Administration
Usage Terms: Public domain
License: Public domain
Attribution Required?: No
Image usage
The following page links to this image:

All content from Kiddle encyclopedia articles (including the article images and facts) can be freely used under Attribution-ShareAlike license, unless stated otherwise.

