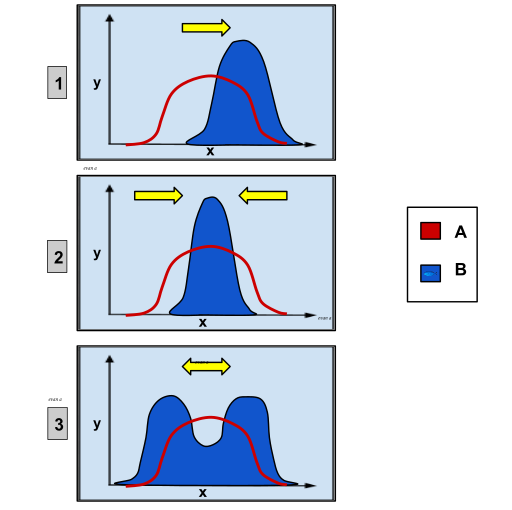
Image: Genetic Distribution

Description: These charts depict the different types of genetic selection. On each graph, the x-axis variable is the type of phenotypic trait and the y-axis variable is the amount of organisms. Group A is the original population and Group B is the population after selection. Graph 1 shows directional selection, in which a single extreme phenotype is favored. Graph 2 depicts stabilizing selection, where the intermediate phenotype is favored over the extreme traits. Graph 3 shows disruptive selection, in which the extreme phenotypes are favored over the intermediate.
Title: Genetic Distribution
Credit: Own work
Author: Ealbert17
Usage Terms: Creative Commons Attribution-Share Alike 4.0
License: CC BY-SA 4.0
License Link: https://creativecommons.org/licenses/by-sa/4.0
Attribution Required?: Yes
Image usage
The following page links to this image:

