
Image: GSTA 1850-2019
No higher resolution available.
GSTA_1850-2019.png (640 × 480 pixels, file size: 21 KB, MIME type: image/png)
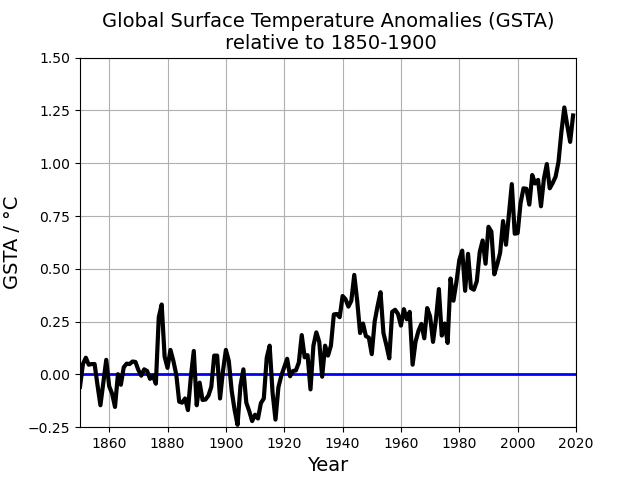
Description: Plot of Global Surface Temperature Anomalies (GSTA) from 1850-2019 relative to 1850-1900 from HadCRUT4.6 observations, as depicted in the Summary for Policymakers of the IPCC Sixth Assessment Report.Data was made available under a Creative Commons Attribution 4.0 International License, see https://www.ipcc.ch/report/ar6/wg1/#SPM . Plot is by me, using Matplotlib
Title: GSTA 1850-2019
Credit: Own work
Author: LukeSurl
Usage Terms: Creative Commons Attribution-Share Alike 4.0
License: CC BY-SA 4.0
License Link: https://creativecommons.org/licenses/by-sa/4.0
Attribution Required?: Yes
Image usage
The following page links to this image:

All content from Kiddle encyclopedia articles (including the article images and facts) can be freely used under Attribution-ShareAlike license, unless stated otherwise.