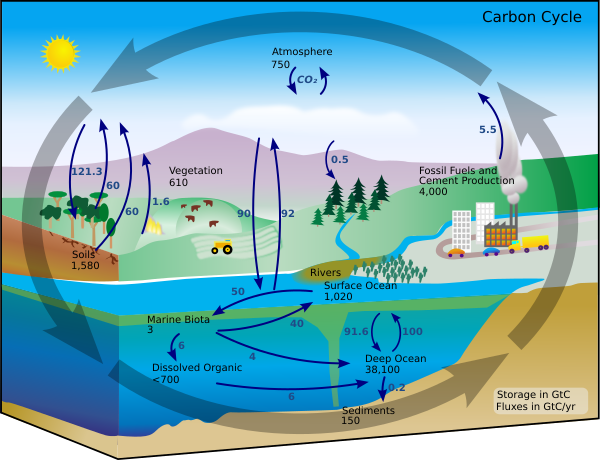
Image: Carbon cycle-cute diagram

Description: This carbon cycle diagram shows the storage and annual exchange of carbon between the atmosphere, hydrosphere and geosphere in gigatons - or billions of tons - of Carbon (GtC). Burning fossil fuels by people adds about 5.5 GtC of carbon per year into the atmosphere.
Title: Carbon cycle-cute diagram
Credit: Own work based on: Carbon cycle-cute diagram.jpeg (i.e. https://earthobservatory.nasa.gov/features/CarbonCycle)
Author: Original: Kevin Saff Vector: FischX
Permission: Public domainPublic domainfalsefalse I, the copyright holder of this work, release this work into the public domain. This applies worldwide. In some countries this may not be legally possible; if so: I grant anyone the right to use this work for any purpose, without any conditions, unless such conditions are required by law.
Usage Terms: Public domain
License: Public domain
Attribution Required?: No
Image usage
The following page links to this image:

