
Image: Bank Common Equity to Assets Ratios 2004 - 2008

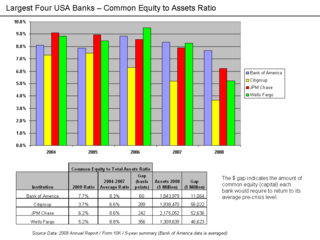
Description: Common Equity to Total Assets Ratios for major U.S. banks Source Data The source data is from the 2008 annual reports of each company available on their website. There is a five year annual summary that contains the source data used. Note that Bank of America (unlike the others) averages its numbers. Wells Fargo Citigroup Bank of America JP Morgan Chase A basis point is 1/100th of a percentage point. The concept of the gap analysis is to indicate how much additional common stock equity each bank would have to acquire to return to its 2004-2007 average ratio. Computation steps: Identify the basis-point gap between the 2008 ratio and 2004-2007 average ratio. Multiply the gap amount times the total assets of the bank. This shows the amount of additional capital required to return to the banks own pre-crisis averages. The amounts are in millions. For example, Wells Fargo would require $46.6 billion to return to its pre-crisis level of common equity capitalization. Alan Greenspan wrote in a March 2009 article that U.S. banks would require another $850 billion in his estimation, representing "an additional 3-4 percentage points of cushion in their equity capital to assets ratios."[1]
Title: Bank Common Equity to Assets Ratios 2004 - 2008
Credit: Annual Reports of each entity
Author: Farcaster (talk) 05:12, 4 May 2009 (UTC)
Usage Terms: Creative Commons Attribution-Share Alike 3.0
License: CC BY-SA 3.0
License Link: https://creativecommons.org/licenses/by-sa/3.0
Attribution Required?: Yes
Image usage
The following page links to this image:
