
Image: 2021 CO2 emissions by income decile - International Energy Agency IEA

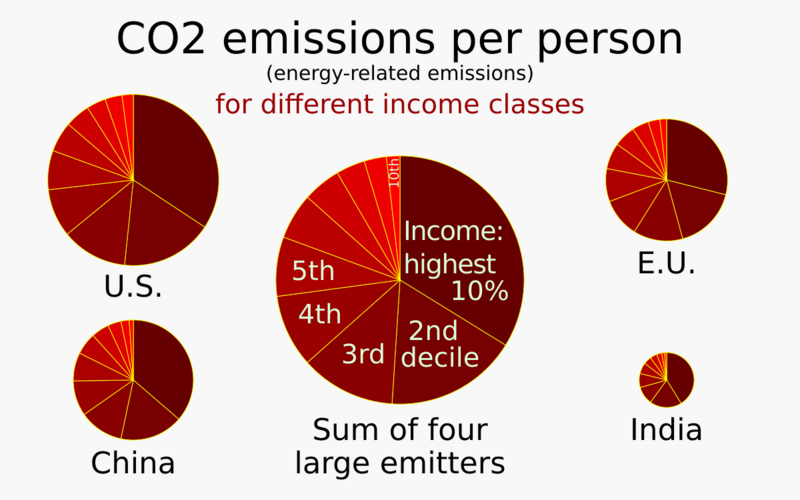
Description: Diagram with pie charts showing CO2 emissions per person, for several high-emissions countries, distinguishing by income class (income decile) Source for data: Cozzi, Laura; Chen, Olivia; Kim, Hyeji, The world’s top 1% of emitters produce over 1000 times more CO2 than the bottom 1%. iea.org. International Energy Agency (IEA) (22 February 2023). Archived from the original on 3 March 2023. "Methodological note: ...The analysis accounts for energy-related CO2, and not other greenhouse gases, nor those related to land use and agriculture." Quantities are illustrated by areas of pie charts. The pie charts were automatically generated using the "pie charts" spreadsheet linked at User:RCraig09/Excel to XML for SVG This SVG file contains embedded text that can be translated into your language, using any capable SVG editor, text editor or the SVG Translate tool. For more information see: About translating SVG files.
Title: 2021 CO2 emissions by income decile - International Energy Agency IEA
Credit: Own work
Author: RCraig09
Usage Terms: Creative Commons Attribution-Share Alike 4.0
License: CC BY-SA 4.0
License Link: https://creativecommons.org/licenses/by-sa/4.0
Attribution Required?: Yes
Image usage
The following page links to this image:
