
Image: 1b-ACA Distribution in 2014
Size of this preview: 800 × 500 pixels. Other resolutions: 320 × 200 pixels | 1,264 × 790 pixels.
Original image (1,264 × 790 pixels, file size: 65 KB, MIME type: image/png)
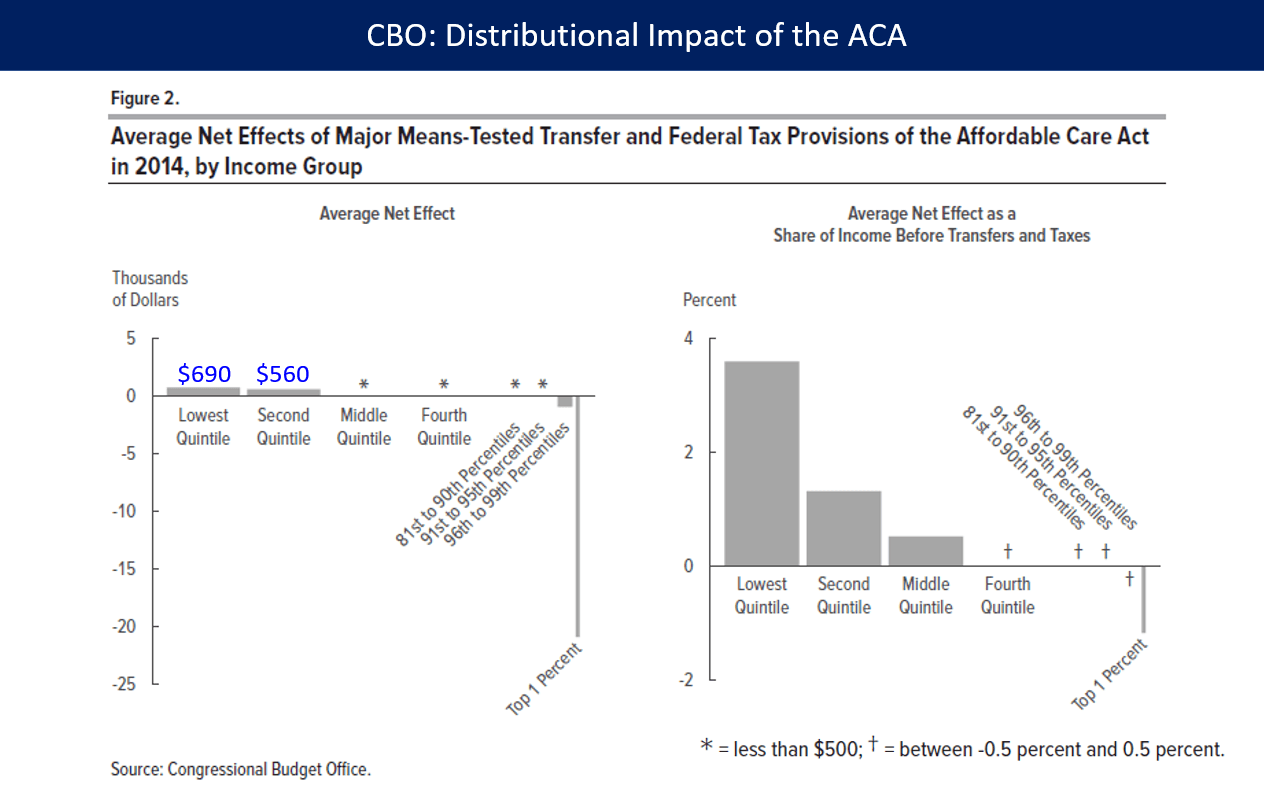
Description: The distributional impact of the Affordable Care Act (ACA or Obamacare) during 2014. The ACA raised taxes mainly on the top 1% to fund approximately $600 in benefits on average for the bottom 40% of families.
Title: 1b-ACA Distribution in 2014
Credit: https://www.cbo.gov/publication/53597
Author: Congressional Budget Office
Usage Terms: Public domain
License: Public domain
Attribution Required?: No
Image usage
The following 3 pages link to this image:

All content from Kiddle encyclopedia articles (including the article images and facts) can be freely used under Attribution-ShareAlike license, unless stated otherwise.