
Image: 1990- Annual greenhouse gas emissions - U.S. - line chart

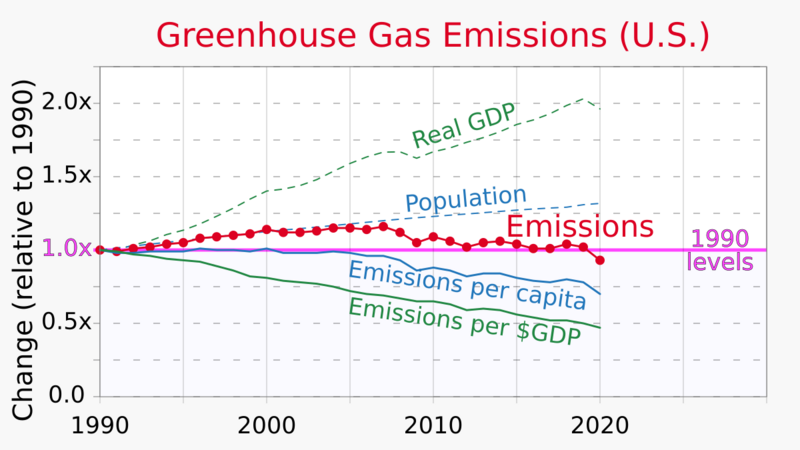
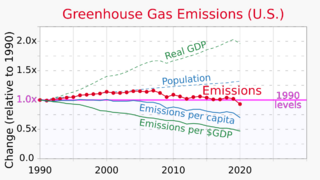
Description: Line chart showing annual greenhouse gas emissions of the United States annually since 1990, including total emissions, emissions per capita, and emissions per GDP Source data: Climate Change Indicators: U.S. Greenhouse Gas Emissions / Figure 3. U.S. Greenhouse Gas Emissions per Capita and per Dollar of GDP, 1990–2020. EPA.gov. U.S. Environmental Protection Agency. Archived from the original on 5 April 2023. Archive thereof: https://web.archive.org/web/20230405092424/https://www.epa.gov/climate-indicators/climate-change-indicators-us-greenhouse-gas-emissions Greenhouse gas emissions (data for red trace in Version 1) was derived from other data provided in source. Source explains: "Indicator Notes. While this indicator includes the major greenhouse gases emitted by human activities, it does not include other greenhouse gases and substances that are not covered under the United Nations Framework Convention on Climate Change but that still affect the Earth’s energy balance and climate (see the Climate Forcing indicator for more details). For example, this indicator excludes ozone-depleting substances such as chlorofluorocarbons (CFCs) and hydrochlorofluorocarbons (HCFCs), which have high global warming potentials, as these gases have been or are currently being phased out under an international agreement called the Montreal Protocol. This indicator also excludes black carbon and aerosols, which most greenhouse gas emissions inventories do not cover. While there are many natural greenhouse gas emissions sources, this indicator focuses on emissions that are associated with human activities—those that are most responsible for the observed buildup of these gases in our atmosphere. Although the land use, land-use change, and forestry emission estimates include emissions and sinks from unmanaged lands due to forest growth, fires, and other factors, this indicator does not include other natural sources such as methane emissions from unmanaged wetlands." Source states: "Data Sources. Data for this indicator came from EPA’s Inventory of U.S. Greenhouse Gas Emissions and Sinks: 1990–2020. This report is available online at: www.epa.gov/ghgemissions/inventory-us-greenhouse-gas-emissions-and-sinks. The calculations in Figure 3 are based on GDP and population data provided by the U.S. Bureau of Economic Analysis and the U.S. Census, respectively." SVG code for this graphic was automatically generated by the "Line charts" and "Scatterplots" spreadsheets linked at User:RCraig09/Excel to XML for SVG. Some text and other additions and adjustments were added manually in text editor. This SVG file contains embedded text that can be translated into your language, using any capable SVG editor, text editor or the SVG Translate tool. For more information see: About translating SVG files.
Title: 1990- Annual greenhouse gas emissions - U.S. - line chart
Credit: Own work
Author: RCraig09
Usage Terms: Creative Commons Attribution-Share Alike 4.0
License: CC BY-SA 4.0
License Link: https://creativecommons.org/licenses/by-sa/4.0
Attribution Required?: Yes
Image usage
The following page links to this image:
