
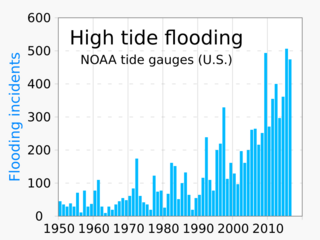
Image: 1950- High tide flooding, by year - NOAA tide gauges (U.S.)

Description: Vertical bar chart showing high tide flooding incidents, by year from 1950-, measured by NOAA tide gauges around the U.S. Data source: Sweet, William V.; Dusek, Greg; Obeysekera, Jayantha; Marra, John J. Patterns and Projections of High Tide Flooding Along the U.S. Coastline Using a Common Impact Threshold. tidesandcurrents.NOAA.gov 4. National Oceanic and Atmospheric Administration (NOAA) (February 2018). Archived from the original on 15 October 2022. "Fig. 2b" Most of the SVG code in this chart was automatically generated using the Vertical Bar Chart spreadsheet linked at User:RCraig09/Excel to XML for SVG. Uploader nudged and re-colored certain text manually, using a text editor. This SVG file contains embedded text that can be translated into your language, using any capable SVG editor, text editor or the SVG Translate tool. For more information see: About translating SVG files.
Title: 1950- High tide flooding, by year - NOAA tide gauges (U.S.)
Credit: Own work
Author: RCraig09
Usage Terms: Creative Commons Attribution-Share Alike 4.0
License: CC BY-SA 4.0
License Link: https://creativecommons.org/licenses/by-sa/4.0
Attribution Required?: Yes
Image usage
The following page links to this image:

.svg)