Hardiness zone facts for kids
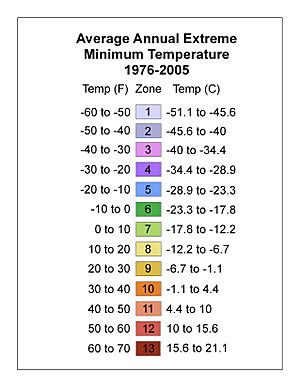
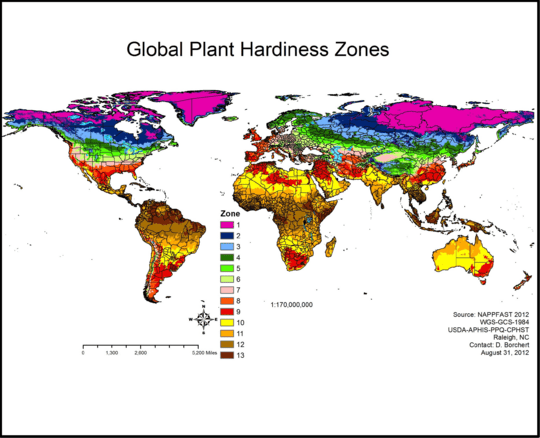
A hardiness zone is a geographic area defined as having a certain average annual minimum temperature, a factor relevant to the survival of many plants. In some systems other statistics are included in the calculations. The original and most widely used system, developed by the United States Department of Agriculture (USDA) as a rough guide for landscaping and gardening, defines 13 zones by long-term average annual extreme minimum temperatures. It has been adapted by and to other countries (such as Canada) in various forms. A plant may be described as "hardy to zone 10": this means that the plant can withstand a minimum temperature of 30 to 40 °F (−1.1 to 4.4 °C).
Unless otherwise specified, in American contexts "hardiness zone" or simply "zone" usually refers to the USDA scale.
Other hardiness rating schemes have been developed as well, such as the UK Royal Horticultural Society and US Sunset Western Garden Book systems.
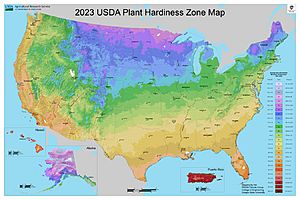
In November 2023, the USDA released an updated version of their plant hardiness map, based on 1991–2020 weather data across the United States. The updated map shows continued northward movement of hardiness zones, reflecting a continued warming trend in the United States' climate from 1991 to 2020.
Contents
United States hardiness zones (USDA scale)
The USDA system was originally developed to aid gardeners and landscapers in the United States.
In the United States, most of the warmer zones (zones 9, 10, and 11) are located in the deep southern half of the country and on the southern coastal margins. Higher zones can be found in Hawaii (up to 12) and Puerto Rico (up to 13). The southern middle portion of the mainland and central coastal areas are in the middle zones (zones 8, 7, and 6). The far northern portion on the central interior of the mainland have some of the coldest zones (zones 5, 4, and small area of zone 3) and often have much less consistent range of temperatures in winter due to being more continental, especially further west with higher diurnal temperature variations, and thus the zone map has its limitations in these areas. Lower zones can be found in Alaska (down to 1). The low latitude and often stable weather in Florida, the Gulf Coast, and southern Arizona and California, are responsible for the rarity of episodes of severe cold relative to normal in those areas. The warmest zone in the 48 contiguous states is the Florida Keys (11b) and the coldest is in north-central Minnesota (2b). A couple of locations on the northern coast of Puerto Rico have the warmest hardiness zone in the United States at 13b. Conversely, isolated inland areas of Alaska have the coldest hardiness zone in the United States at 1a.
Definitions
| Zone | From | To | |
|---|---|---|---|
| 0 | a | < −65 °F (−53.9 °C) | |
| b | −65 °F (−53.9 °C) | −60 °F (−51.1 °C) | |
| 1 | a | −60 °F (−51.1 °C) | −55 °F (−48.3 °C) |
| b | −55 °F (−48.3 °C) | −50 °F (−45.6 °C) | |
| 2 | a | −50 °F (−45.6 °C) | −45 °F (−42.8 °C) |
| b | −45 °F (−42.8 °C) | −40 °F (−40 °C) | |
| 3 | a | −40 °F (−40 °C) | −35 °F (−37.2 °C) |
| b | −35 °F (−37.2 °C) | −30 °F (−34.4 °C) | |
| 4 | a | −30 °F (−34.4 °C) | −25 °F (−31.7 °C) |
| b | −25 °F (−31.7 °C) | −20 °F (−28.9 °C) | |
| 5 | a | −20 °F (−28.9 °C) | −15 °F (−26.1 °C) |
| b | −15 °F (−26.1 °C) | −10 °F (−23.3 °C) | |
| 6 | a | −10 °F (−23.3 °C) | −5 °F (−20.6 °C) |
| b | −5 °F (−20.6 °C) | 0 °F (−17.8 °C) | |
| 7 | a | 0 °F (−17.8 °C) | 5 °F (−15 °C) |
| b | 5 °F (−15 °C) | 10 °F (−12.2 °C) | |
| 8 | a | 10 °F (−12.2 °C) | 15 °F (−9.4 °C) |
| b | 15 °F (−9.4 °C) | 20 °F (−6.7 °C) | |
| 9 | a | 20 °F (−6.7 °C) | 25 °F (−3.9 °C) |
| b | 25 °F (−3.9 °C) | 30 °F (−1.1 °C) | |
| 10 | a | 30 °F (−1.1 °C) | +35 °F (1.7 °C) |
| b | +35 °F (1.7 °C) | +40 °F (4.4 °C) | |
| 11 | a | +40 °F (4.4 °C) | +45 °F (7.2 °C) |
| b | +45 °F (7.2 °C) | +50 °F (10 °C) | |
| 12 | a | +50 °F (10 °C) | +55 °F (12.8 °C) |
| b | +55 °F (12.8 °C) | 60 °F (15.6 °C) | |
| 13 | a | 60 °F (15.6 °C) | 65 °F (18.3 °C) |
| b | > 65 °F (18.3 °C) | ||
History
The first attempts to create a geographical hardiness zone system were undertaken by two researchers at the Arnold Arboretum in Boston; the first was published in 1927 by Alfred Rehder, and the second by Donald Wyman in 1938. The Arnold map was subsequently updated in 1951, 1967, and finally 1971, but eventually fell out of use completely.
The modern USDA system began at the US National Arboretum in Washington. The first map was issued in 1960, and revised in 1965. It used uniform 10 °F (5.6 °C) ranges, and gradually became widespread among American gardeners.
Selected U.S. cities
The USDA plant hardiness zones for selected U.S. cities as based on the 2023 map are the following:
Limitations
As the USDA system is based entirely on average annual extreme minimum temperature in an area, it is limited in its ability to describe the climatic conditions a gardener may have to account for in a particular area: there are many other factors that determine whether or not a given plant can survive in a given zone.
Zone information alone is often not adequate for predicting winter survival, since factors such as frost dates and frequency of snow cover can vary widely between regions. Even the extreme minimum itself may not be useful when comparing regions in widely different climate zones. As an extreme example, due to the Gulf stream most of the United Kingdom is in zones 8–9, while in the US, zones 8–9 include regions such as the subtropical coastal areas of the southeastern US and Mojave and Chihuahuan inland deserts, thus an American gardener in such an area may only have to plan for several nights of cold temperatures per year, while their British counterpart may have to plan for several months.
In addition, the zones do not incorporate any information about duration of cold temperatures, summer temperatures, or sun intensity insolation; thus sites which may have the same mean winter minima on the few coldest nights and be in the same garden zone, but have markedly different climates. For example, zone 8 covers coastal, high latitude, cool summer locations like Seattle and London, as well as lower latitude, hot-summer climates like Charleston and Madrid. Farmers, gardeners, and landscapers in the former two must plan for entirely different growing conditions from those in the latter, in terms of length of hot weather and sun intensity. Coastal Ireland and central Florida are both Zone 10, but have radically different climates.
The hardiness scales do not take into account the reliability of snow cover in the colder zones. Snow acts as an insulator against extreme cold, protecting the root system of hibernating plants. If the snow cover is reliable, the actual temperature to which the roots are exposed will not be as low as the hardiness zone number would indicate. As an example, Quebec City in Canada is located in zone 4, but can rely on a significant snow cover every year, making it possible to cultivate plants normally rated for zones 5 or 6. But, in Montreal, located to the southwest in zone 5, it is sometimes difficult to cultivate plants adapted to the zone because of the unreliable snow cover.
Many plants may survive in a locality but will not flower if the day length is insufficient or if they require vernalization (a particular duration of low temperature).
There are many other climate parameters that a farmer, gardener, or landscaper may need to take into account as well, such as humidity, precipitation, storms, rainy-dry cycles or monsoons, and site considerations such as soil type, soil drainage and water retention, water table, tilt towards or away from the sun, natural or manmade protection from excessive sun, snow, frost, and wind, etc. The annual extreme minimum temperature is a useful indicator, but ultimately only one factor among many for plant growth and survival.
Alternatives
An alternative means of describing plant hardiness is to use "indicator plants". In this method, common plants with known limits to their range are used.
Sunset publishes a series that breaks up climate zones more finely than the USDA zones, identifying 45 distinct zones in the US, incorporating ranges of temperatures in all seasons, precipitation, wind patterns, elevation, and length and structure of the growing season.
In addition, the Köppen climate classification system can be used as a more general guide to growing conditions when considering large areas of the Earth's surface or attempting to make comparisons between different continents. The Trewartha climate classification is often a good "real world" concept of climates and their relation to plants and their average growing conditions.
Australian hardiness zones
The Australian National Botanic Gardens have devised another system keeping with Australian conditions. The zones are defined by steps of 5 degrees Celsius, from −15–−10 °C for zone 1 to 15–20 °C for zone 7. They are numerically about 6 lower than the USDA system. For example, Australian zone 3 is roughly equivalent to USDA zone 9. The higher Australian zone numbers had no US equivalents prior to the 2012 addition by USDA of zones 12 and 13.
The spread of weather stations may be insufficient and too many places with different climates are lumped together. Only 738 Australian stations have records of more than ten years (one station per 98,491 hectares or 243,380 acres), though more populated areas have relatively fewer hectares per station. Mount Isa has three climatic stations with more than a ten-year record. One is in zone 4a, one in zone 4b, and the other is in zone 5a. Sydney residents are split between zones 3a and 4b. Different locations in the same city are suitable for different plants.
Canadian hardiness zones
For practical purposes, Canada has adopted the American hardiness zone classification system. The Canadian government publishes both Canadian and USDA-style zone maps.
Effects of climate change
The USDA map published in 2012 shows that most of the US has become a half zone (2.8 °C or 5 °F) hotter in winter compared to the 1990 release. Again, with the publication of the 2023 map, about half of the US has shifted a half zone warmer. Research in 2016 suggests that USDA plant hardiness zones will shift even further northward under climate change.
Images for kids
-
A garden in Simrishamn, southern Sweden.
See also
 In Spanish: Zona de rusticidad para niños
- Agriculture
- Gardening
- Geographical zone
- Hardiness (plants)
- Subtropics


