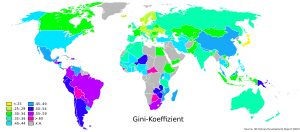
Gini coefficient facts for kids
The Gini coefficient (also known as the Gini index or Gini ratio) is a measure of differences in income. It was developed by the Italian statistician Corrado Gini in 1912.
Contents
Definition
The Gini coefficient is usually a number between 0 and 1 (or 0 to 100). 0 means a country where the income is equally distributed. On the other hand, 1 means that one person owns everything but the rest owns nothing. In reality, all scores are between 0.25 and 0.6 (between 25 and 60 on the 0 to 100 scale).
Statistics
The table below is about the world Gini coefficient (not by single countries).
| Year | World Gini index |
|---|---|
| 1820 | 0.43 |
| 1850 | 0.53 |
| 1870 | 0.56 |
| 1913 | 0.61 |
| 1929 | 0.62 |
| 1950 | 0.64 |
| 1960 | 0.64 |
| 1980 | 0.66 |
| 2002 | 0.71 |
| 2005 | 0.68 |
The table below shows the income Gini coefficient of the United States from 1947 to 2009.
| Year | pre-tax Gini |
|---|---|
| 1947 | 0.413 |
| 1967 | 0.397 |
| 1968 | 0.386 |
| 1970 | 0.394 |
| 1980 | 0.403 |
| 1990 | 0.428 |
| 2000 | 0.462 |
| 2005 | 0.469 |
| 2006 | 0.470 |
| 2007 | 0.463 |
| 2008 | 0.467 |
| 2009 | 0.468 |
Images for kids
-
Growth spells last longer in more equal countries. A 10 percentile increase in equality (represented by a change in the Gini index value from 40 to 37) increases the expected length of a growth spell by 50 percent. Percentage changes in GDP growth spell length are shown as each factor moves from 50th to 60th percentile and all other factors are held constant. Income distribution is measured by the Gini coefficient.
See also
 In Spanish: Coeficiente de Gini para niños


