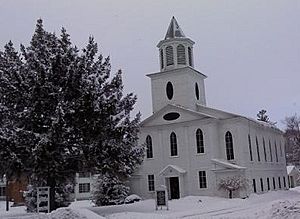
Elbridge (village), New York facts for kids
Quick facts for kids
Elbridge, New York
|
|
|---|---|

Location in Onondaga County and the state of New York.
|
|
| Country | United States |
| State | New York |
| County | Onondaga |
| Area | |
| • Total | 0.99 sq mi (2.58 km2) |
| • Land | 0.99 sq mi (2.58 km2) |
| • Water | 0.00 sq mi (0.00 km2) |
| Population
(2020)
|
|
| • Total | 921 |
| • Density | 926.56/sq mi (357.62/km2) |
| Time zone | UTC-5 (Eastern (EST)) |
| • Summer (DST) | UTC-4 (EDT) |
| ZIP codes |
13060
|
| Area code(s) | 315 |
| FIPS code | 36-23789 |
Elbridge is a village located in the western part of the town of Elbridge in western Onondaga County, New York, United States, about 15 miles (24 km) west of Syracuse. It is part of the Syracuse Metropolitan Statistical Area. As of the 2020 census, the population was 921.
Contents
History
The village is in the former Central New York Military Tract. The first settler was Josiah Buck, a government surveyor sent there in 1791 to map the area. He was so impressed that he returned with his family in 1793.
Elbridge became an incorporated village in 1848.
With the growth of nearby Syracuse, Elbridge lost manufacturing facilities and population before the beginning of the 20th century.
The Elbridge Village Historic District was listed on the National Register of Historic Places in 2002.
Geography
Elbridge is located at 43°2′3″N 76°26′35″W / 43.03417°N 76.44306°W (43.034266, -76.443282). According to the United States Census Bureau, the village has a total area 1.0 square mile (2.6 km2), all land.
The area around the village is very hilly and the most famous hill in the village is Science Hill. Skaneateles Creek flows past the western side of the village.
New York State Route 5 intersects New York State Route 317 in the village.
Demographics
| Historical population | |||
|---|---|---|---|
| Census | Pop. | %± | |
| 1860 | 544 | — | |
| 1870 | 463 | −14.9% | |
| 1880 | 516 | 11.4% | |
| 1890 | 693 | 34.3% | |
| 1900 | 549 | −20.8% | |
| 1910 | 462 | −15.8% | |
| 1920 | 382 | −17.3% | |
| 1930 | 452 | 18.3% | |
| 1940 | 497 | 10.0% | |
| 1950 | 586 | 17.9% | |
| 1960 | 828 | 41.3% | |
| 1970 | 1,040 | 25.6% | |
| 1980 | 1,099 | 5.7% | |
| 1990 | 1,219 | 10.9% | |
| 2000 | 1,103 | −9.5% | |
| 2010 | 1,058 | −4.1% | |
| 2020 | 921 | −12.9% | |
| U.S. Decennial Census | |||
As of the census of 2000, there were 1,103 people, 427 households, and 321 families residing in the village. The population density was 1,052.2 inhabitants per square mile (406.3/km2). There were 445 housing units at an average density of 424.5 per square mile (163.9/km2). The racial makeup of the village was 97.28% White, 0.09% Black or African American, 0.54% Native American, 0.63% Asian, 0.18% from other races, and 1.27% from two or more races. Hispanic or Latino of any race were 1.54% of the population.
There were 427 households, out of which 33.5% had children under the age of 18 living with them, 61.6% were married couples living together, 10.1% had a female householder with no husband present, and 24.8% were non-families. 21.1% of all households were made up of individuals, and 8.4% had someone living alone who was 65 years of age or older. The average household size was 2.58 and the average family size was 3.00.
In the village, the population was spread out, with 24.8% under the age of 18, 6.9% from 18 to 24, 27.4% from 25 to 44, 24.9% from 45 to 64, and 16.0% who were 65 years of age or older. The median age was 40 years. For every 100 females, there were 99.5 males. For every 100 females age 18 and over, there were 96.7 males.
The median income for a household in the village was $44,712, and the median income for a family was $49,539. Males had a median income of $36,750 versus $27,321 for females. The per capita income for the village was $21,376. About 3.8% of families and 4.8% of the population were below the poverty line, including 8.9% of those under age 18 and 5.7% of those age 65 or over.
Education
The village is in the Jordan-Elbridge Central School District
See also
 In Spanish: Elbridge (villa) para niños


