East Tawas, Michigan facts for kids
Quick facts for kids
East Tawas, Michigan
|
|
|---|---|
| City of East Tawas | |

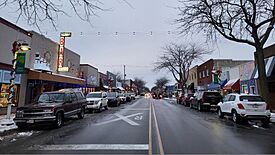
Downtown East Tawas along Newman Street
|
|

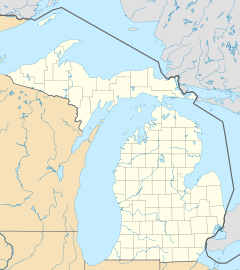
Location within Iosco County
|
|
| Country | United States |
| State | Michigan |
| County | Iosco |
| Settled | 1862 |
| Incorporated | 1887 (village) 1895 (city) |
| Government | |
| • Type | Council–manager |
| Area | |
| • Total | 3.27 sq mi (8.47 km2) |
| • Land | 2.81 sq mi (7.28 km2) |
| • Water | 0.46 sq mi (1.19 km2) |
| Elevation | 584 ft (178 m) |
| Population
(2020)
|
|
| • Total | 2,663 |
| • Density | 946.68/sq mi (365.50/km2) |
| Time zone | UTC-5 (Eastern (EST)) |
| • Summer (DST) | UTC-4 (EDT) |
| ZIP code(s) |
48730
|
| Area code(s) | 989 |
| FIPS code | 26-24420 |
| GNIS feature ID | 0625264 |
East Tawas is a city in Iosco County in the U.S. state of Michigan. The population was 2,663 at the 2020 census.
History
The western New York firm Smith, Van Valkenburg, & Company bought land in the area in order to exploit the area's lumber resources. George Smith settled in the area in 1862 and founded the community. The East Tawas post office opened on April 15, 1867. A predecessor of the Detroit and Mackinac Railway built a station here, and the community incorporated as a village in 1887 and later as a city in 1895. Tawas Beach was established nearby in 1903 along the railway line in Baldwin Township. A post office opened here on June 12, 1903, until the community was annexed into the city of East Tawas in 1922.
Geography
According to the U.S. Census Bureau, the city has a total area of 3.27 square miles (8.47 km2), of which 2.81 square miles (7.28 km2) is land and 0.46 square miles (1.19 km2) (14.07) is water.
Tawas Point State Park is located near East Tawas in Baldwin Township.
Climate
| Climate data for East Tawas, Michigan (1991–2020 normals, extremes 1890–present) | |||||||||||||
|---|---|---|---|---|---|---|---|---|---|---|---|---|---|
| Month | Jan | Feb | Mar | Apr | May | Jun | Jul | Aug | Sep | Oct | Nov | Dec | Year |
| Record high °F (°C) | 59 (15) |
62 (17) |
78 (26) |
91 (33) |
95 (35) |
101 (38) |
106 (41) |
103 (39) |
101 (38) |
93 (34) |
78 (26) |
65 (18) |
106 (41) |
| Mean daily maximum °F (°C) | 29.7 (−1.3) |
32.3 (0.2) |
40.8 (4.9) |
52.2 (11.2) |
64.9 (18.3) |
75.2 (24.0) |
80.2 (26.8) |
78.8 (26.0) |
71.7 (22.1) |
58.8 (14.9) |
45.5 (7.5) |
35.0 (1.7) |
55.4 (13.0) |
| Daily mean °F (°C) | 21.5 (−5.8) |
22.6 (−5.2) |
30.9 (−0.6) |
42.2 (5.7) |
54.4 (12.4) |
64.2 (17.9) |
69.2 (20.7) |
67.8 (19.9) |
60.4 (15.8) |
48.4 (9.1) |
37.3 (2.9) |
27.8 (−2.3) |
45.6 (7.6) |
| Mean daily minimum °F (°C) | 13.3 (−10.4) |
12.9 (−10.6) |
21.0 (−6.1) |
32.2 (0.1) |
43.8 (6.6) |
53.3 (11.8) |
58.1 (14.5) |
56.7 (13.7) |
49.1 (9.5) |
38.1 (3.4) |
29.1 (−1.6) |
20.5 (−6.4) |
35.7 (2.1) |
| Record low °F (°C) | −25 (−32) |
−29 (−34) |
−20 (−29) |
−7 (−22) |
18 (−8) |
28 (−2) |
33 (1) |
24 (−4) |
21 (−6) |
12 (−11) |
−4 (−20) |
−19 (−28) |
−29 (−34) |
| Average precipitation inches (mm) | 2.08 (53) |
1.82 (46) |
1.90 (48) |
3.42 (87) |
3.24 (82) |
3.29 (84) |
3.10 (79) |
2.95 (75) |
2.92 (74) |
2.95 (75) |
2.53 (64) |
2.07 (53) |
32.27 (820) |
| Average snowfall inches (cm) | 14.3 (36) |
12.4 (31) |
7.2 (18) |
2.9 (7.4) |
0.0 (0.0) |
0.0 (0.0) |
0.0 (0.0) |
0.0 (0.0) |
0.0 (0.0) |
0.1 (0.25) |
2.6 (6.6) |
9.7 (25) |
49.2 (125) |
| Average precipitation days (≥ 0.01 in) | 12.1 | 9.1 | 8.8 | 10.1 | 11.6 | 10.5 | 9.8 | 9.0 | 9.6 | 11.6 | 10.6 | 10.6 | 123.4 |
| Average snowy days (≥ 0.1 in) | 9.0 | 7.6 | 4.3 | 1.3 | 0.0 | 0.0 | 0.0 | 0.0 | 0.0 | 0.0 | 1.8 | 6.8 | 30.8 |
| Source: NOAA | |||||||||||||
Major highways
 US 23 runs through the city.
Demographics
| Historical population | |||
|---|---|---|---|
| Census | Pop. | %± | |
| 1880 | 1,086 | — | |
| 1890 | 2,200 | 102.6% | |
| 1900 | 1,736 | −21.1% | |
| 1910 | 1,452 | −16.4% | |
| 1920 | 1,398 | −3.7% | |
| 1930 | 1,455 | 4.1% | |
| 1940 | 1,670 | 14.8% | |
| 1950 | 2,040 | 22.2% | |
| 1960 | 2,462 | 20.7% | |
| 1970 | 2,372 | −3.7% | |
| 1980 | 2,584 | 8.9% | |
| 1990 | 2,887 | 11.7% | |
| 2000 | 2,951 | 2.2% | |
| 2010 | 2,808 | −4.8% | |
| 2020 | 2,663 | −5.2% | |
| U.S. Decennial Census | |||
2010 census
As of the census of 2010, there were 2,808 people, 1,332 households, and 756 families residing in the city. The population density was 988.7 inhabitants per square mile (381.7/km2). There were 1,728 housing units at an average density of 608.5 per square mile (234.9/km2). The racial makeup of the city was 95.7% White, 0.2% African American, 0.3% Native American, 1.1% Asian, 0.1% Pacific Islander, 0.7% from other races, and 1.9% from two or more races. Hispanic or Latino residents of any race were 2.0% of the population.
There were 1,332 households, of which 21.4% had children under the age of 18 living with them, 42.6% were married couples living together, 10.1% had a female householder with no husband present, 4.1% had a male householder with no wife present, and 43.2% were non-families. 38.9% of all households were made up of individuals, and 20.4% had someone living alone who was 65 years of age or older. The average household size was 2.06 and the average family size was 2.70.
The median age in the city was 50.9 years. 18.6% of residents were under the age of 18; 5% were between the ages of 18 and 24; 17.7% were from 25 to 44; 31.2% were from 45 to 64; and 27.5% were 65 years of age or older. The gender makeup of the city was 45.2% male and 54.8% female.
Education
The city is served by Tawas Area Schools.
Holy Family School is a private parochial elementary school in East Tawas serving approximately 80 students in grades K-6. It is affiliated with the Diocese of Gaylord of the Roman Catholic Church, and is a member of the National Catholic Educational Association.
See also
 In Spanish: East Tawas para niños


